PWA using Web Share API
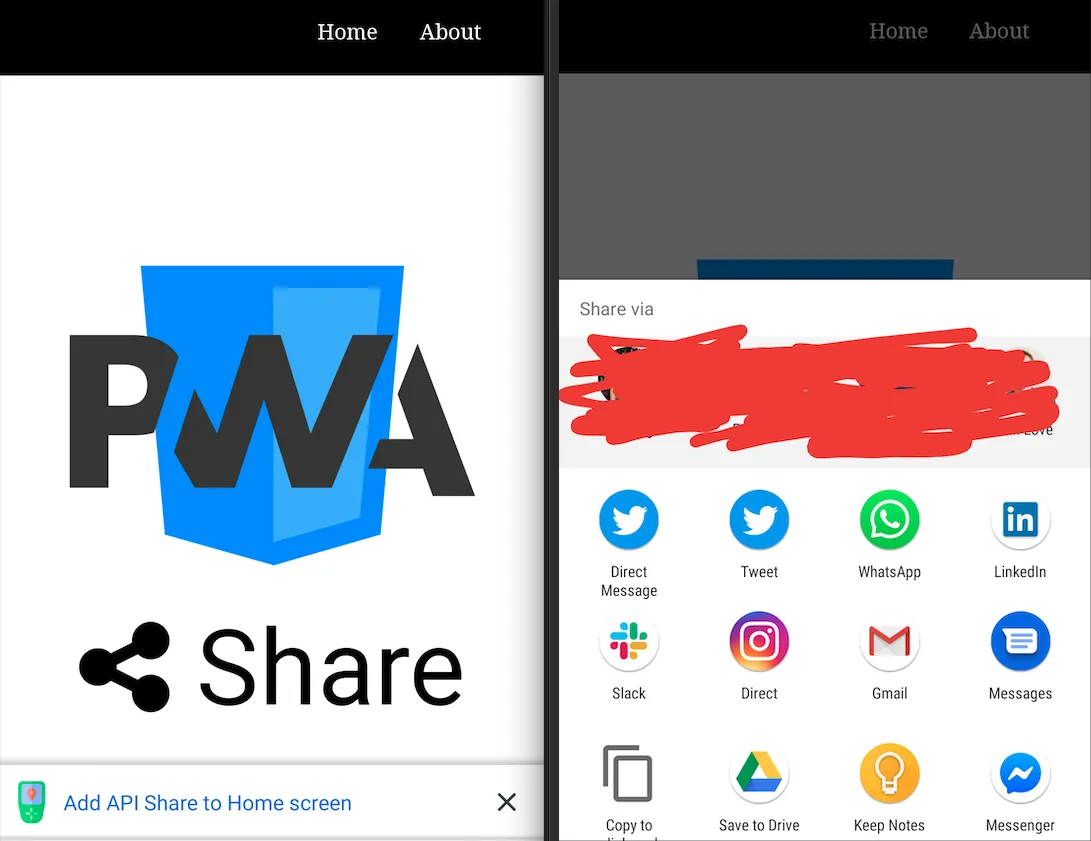
Have you wondered how you can make a use of the "social" sharing API PWA? You know, when you want to share something, and it gives you the option to share via email, Twitter, Instagram, etc? Well, it's actually very easy! Take a look at the demo app to test it on your device.
LIVE DEMO
https://pwa-share-api.firebaseapp.com/
About the project
I have built the sample project that can be found in this repo. In this project, you can see how I added the share functionality to the PWA , but you don't need a service worker or a PWA to add this functionality. I added it to this project because I wanted to show you how to do it specifically in a PWA, but you can add my code to any web app easily!
Web Share API
The bland definition of what a WSA is:
The Web Share API is meant to help developers implement sharing functionality into their apps or websites, but using the device’s native sharing capabilities instead of having to resort to scripts from the individual social platforms and DIY implementations. The API surface is a simple as it gets.- alligator.io
The Web Share API has two share methods: share() and canShare().
The ShareData dictionary of the web share v1 consists of several optional members:
text member: Arbitrary text that forms the body of the message being shared. title member : The title of the document being shared. May be ignored by the target. url member : A URL string referring to a resource being shared.
The canShare() method contains an extra field which is the files property.
files member: A File array referring to files being shared.
To read more about it, check out this link
So let's have a look at how it actually works.
First, let's collect data to make our ShareData dictionary.
const title = document.title;

const url = document.querySelector("link[rel=canonical]")
  ? document.querySelector("link[rel=canonical]").href
  : document.location.href;

const text = "Learn how to use the share api";
Then, after we have declared what we want to share, we can use it in the .share() method.
     try {
       await navigator.share({
        title,
        url,
        text
       })

        /*
          Show a message if the user shares something
        */
        alert(`Thanks for Sharing!`);
    } catch (err) {
       /*
          This error will appear if the user canceled the action of sharing.
        */
       alert(`Couldn't share ${err}`);
    }
We can put that inside of a function, called onShare(), for example.
async function onShare() {
  const title = document.title;
  const url = document.querySelector("link[rel=canonical]")
    ? document.querySelector("link[rel=canonical]").href
    : document.location.href;
  const text = "Learn how to use the share api";
  try {
      await navigator
      .share({
        title,
        url,
        text
      })

        /*
          Show a message if the user shares something
        */
        alert(`Thanks for Sharing!`);
    } catch (err) {
       /*
          This error will appear if the user cancels the action of sharing.
        */
       alert(`Couldn't share ${err}`);
    }
}
Then pass the onShare() as a click handler to the share button.
shareButton.addEventListener("click", onShare);
If you want to take it to the next level, you can check to make sure the web share api is supported by your browser. Your code will look as follows:
function onShare() {
 // ...
 if (navigator.share) {
 //Your code here
 } else {
   alert(`Not supported !!`);
 }
}
If you want to use the canShare(), to send files, your code might look like this
if (navigator.canShare({ files: filesArray })) {
  navigator.share({
    url: 'www.hola.com',
    files: filesArray,
    title: 'Pictures',
    text: 'Photos from Mexico',
  }).then(....)
}
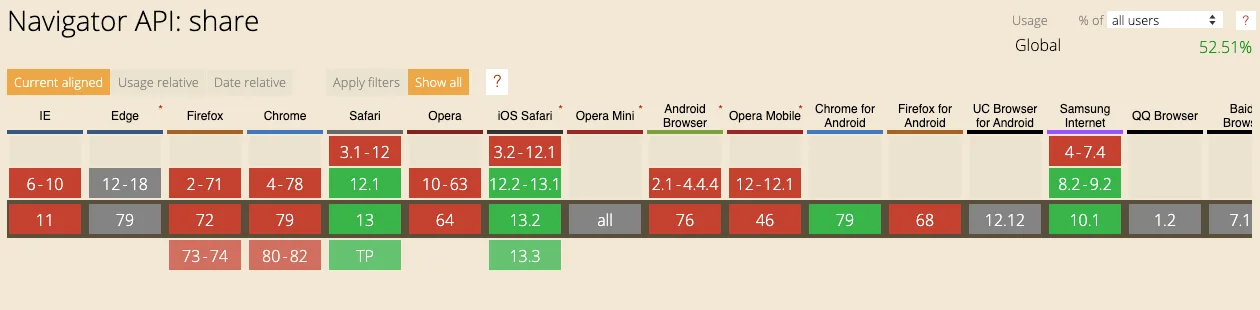
Browser Support
If you go to canisue.com, you can see that browser's support for the share() method. Pretty much every major browser supports it.
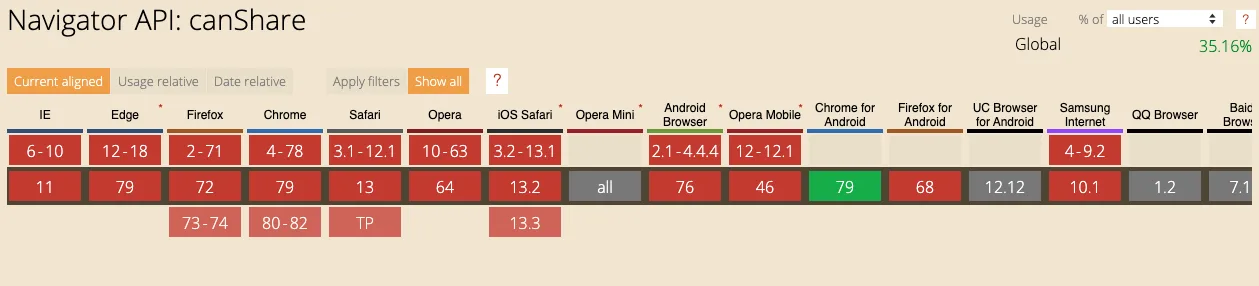
What about the canShare() method? Not as good as the share() method, hopefully it gets to more browsers soon.
Resources
https://www.w3.org/TR/web-share/#sharedata-dictionary https://alligator.io/js/web-share-api/ https://web.dev/web-share/