Skip to content

SSR Finally a First-Class Citizen in Angular?

SSR Finally a First-Class Citizen in Angular?

This article was written over 18 months ago and may contain information that is out of date. Some content may be relevant but please refer to the relevant official documentation or available resources for the latest information.

I am sure you've already heard about server-side rendering (SSR). Generally, it's a technique used to deliver the HTML content generated by the server to the client. The client-side JavaScript framework then hydrates that HTML content to provide a fully interactive application. SSR provides numerous benefits if used correctly, including improved initial load times, better content indexing by search engines, and improved performance on lower-tier devices.

Driven by the need for faster, more efficient web applications, with the rise in popularity of Node.js and, thus, server-side JavaScript, SSR has become a de facto standard in modern web development frameworks. At first, SSR was being provided as a part of meta-frameworks like Next.js, Nuxt, or Analog.js. Then, React introduced React Server Components, which marked a significant milestone in the way we think about front-end development. We think of front-end frameworks as being effectively full-stack, and a purely SPA approach is falling out of favor.

However, I'm willing to bet that if you're a developer focused mostly on Angular, you may not have heard as much about SSR as your React counterparts. For a long time, Angular has been mostly focused on the SPA approach, and while we had Angular Universal or Analog.js, it was not as widely adopted. And that makes sense, given that Angular was widely regarded as best suited for complex, interactive applications, such as SaaS products or internal company tools, where SEO and initial load times were not as critical as they are for consumer-facing applications.

Nevertheless, we have been blessed with the so-called Angular Renaissance, which has, among other things, brought SSR to the forefront of Angular development with the @angular/ssr package. Let's look at what Angular SSR is, how it works, and how you can get started.

@angular/ssr

The @angular/ssr package is not new; it was written from scratch. It's still Angular Universal. However, it's been pulled into the Angular CLI repository, and the appropriate schematics have been added to make it easier to use. What that means is that you can now add SSR to your Angular application with a single command:

ng add @angular/ssr

and you can generate a new SSR application with:

ng new my-ssr-app --ssr

And to make SSR a first-class citizen, the Angular team is planning to make it the default in the next version.

But surely, it's not only rebranding and some CLI commands, you may say. And you're right. You may remember that hydration in Angular Universal has not been optimal as it was destructive and required essentially a complete re-render of the application, thus pretty much negating the benefits of SSR. With the introduction of non-destructive hydration in Angular 16 and its stability in Angular 17, the Angular team has taken a significant step forward in making SSR a first-class citizen.

How to Make an SSR-capable Angular Application

Let's look at how to use Angular SSR in practice by creating a simple SSR app. First, we need to create a new Angular application with SSR support:

ng new my-ssr-app --ssr

That will generate a few server-specific files:

  • server.ts, which is an Express server configured to handle Angular SSR requests by default but can also be extended to handle API routes, or anything else that Express can handle.
  • src/app/app.config.server.ts provides configuration for the server application similar to your app.config.ts, which defines the configuration for your client application. Both export an instance of ApplicationConfig
  • src/main.server.ts bootstraps the server application in a similar way to what main.ts does for your client app by calling the bootstrapApplication function.

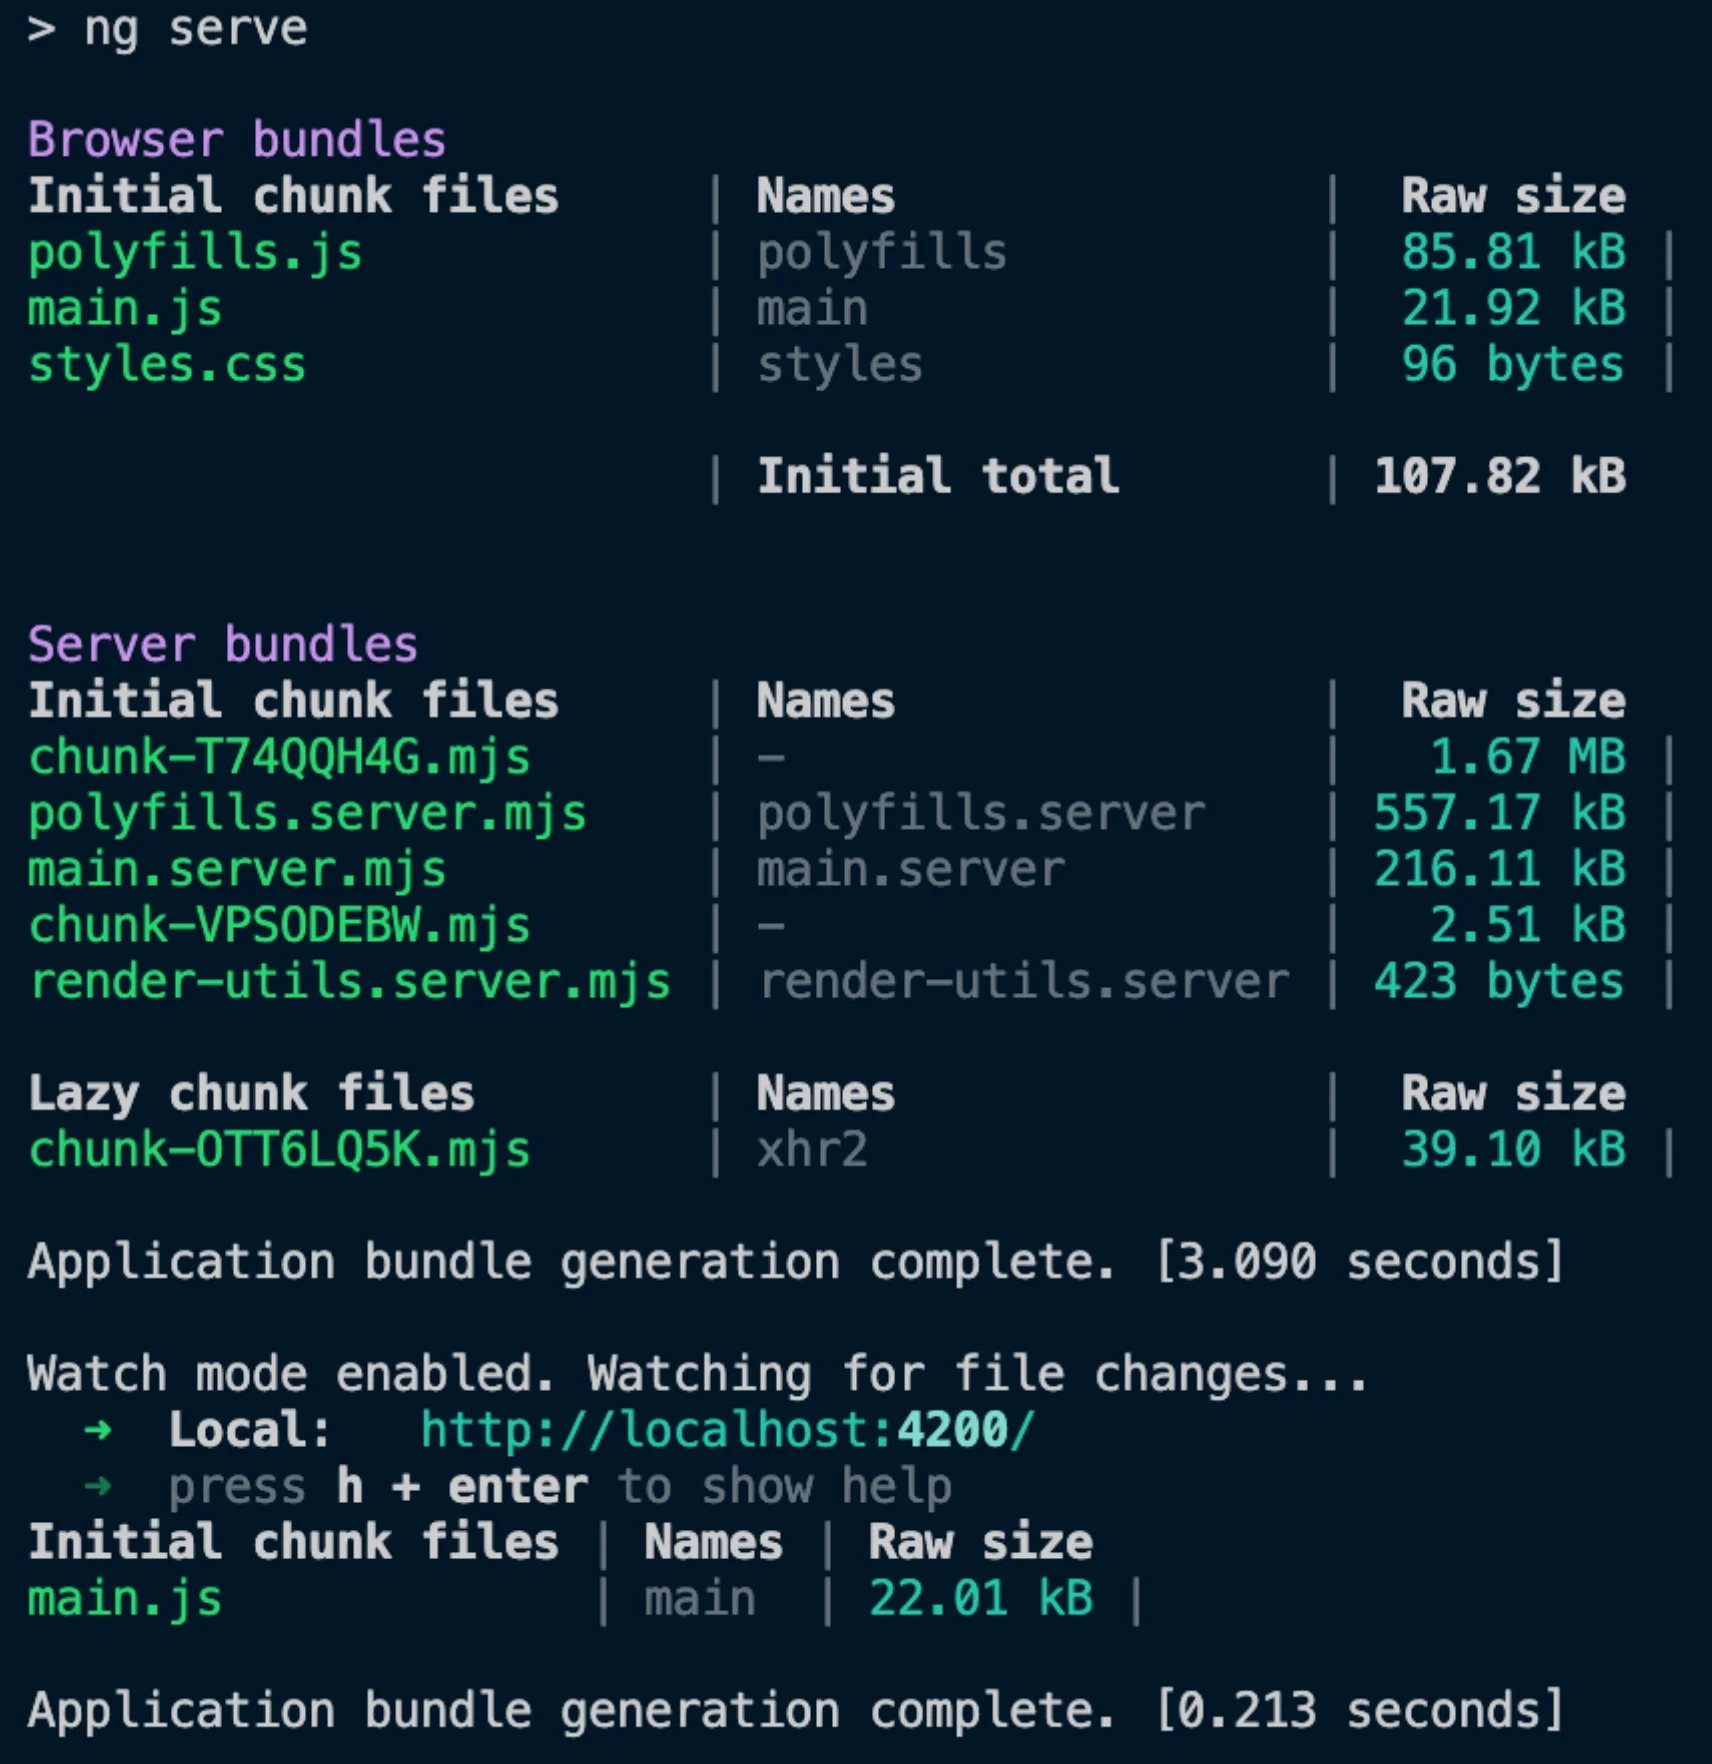
You should have an SSR application ready just like that. You can verify that by running ng serve. The terminal output should show you information about the server bundles generated, and you should be able to see the default app when going to http://localhost:4200.

Screenshot from terminal with stats about generated server and browser bundles.

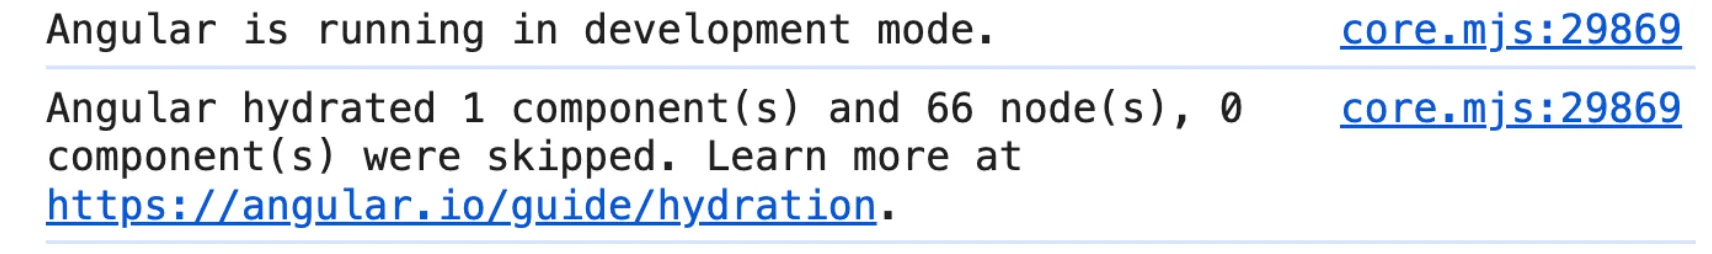
Open the Developer Tools and check the console to see that hydration is enabled. You'll see a message with hydration-related stats, such as the number of components and nodes hydrated.

Screenshot from development console saying that Angular hydrated 1 component and 66 nodes.

Speaking of hydration...

Client Hydration

If you open the src/app/app.config.ts in your new SSR application, you'll notice one interesting provider: provideClientHydration(). This provider is crucial for enabling hydration - a process that restores the server-side rendered application on the client.

Hydration improves application performance by avoiding extra work to re-create DOM nodes. Angular tries to match existing DOM elements to the application's structure at runtime and reuses DOM nodes when possible. This results in a performance improvement measured using Core Web Vitals statistics, such as reducing the Interaction To Next Paint (INP), Largest Contentful Paint (LCP), and Cumulative Layout Shift (CLS). Improving these metrics also positively impacts SEO performance.

Without hydration enabled, server-side rendered Angular applications will destroy and re-render the application's DOM, which may result in visible UI flicker, negatively impact Core Web Vitals like LCP, and cause layout shifts. Enabling hydration allows the existing DOM to be reused and prevents flickering.

Event Replay and Improved Debugging

With Angular 18, event replay, a feature that significantly enhances the SSR experience, came into developer preview. Event replay captures user interactions during the SSR phase and replays them once the application is hydrated. This ensures that user actions, such as adding items to a cart, are not lost during the hydration process, providing a seamless user experience even on slow networks.

To enable event replay, you can add withEventReplay to your provideClientHydration call:

bootstrapApplication(App, {
 providers: [provideClientHydration(withEventReplay())],
});

Furthermore, Angular 18 takes another step towards making SSR a first-class citizen by enhancing the debugging experience with Angular DevTools. Now, DevTools include overlays and detailed error breakdowns, empowering developers to visualize and troubleshoot hydration issues directly in the browser.

Constraints

However, hydration imposes a few constraints on your application that are not present without hydration enabled. Your application must have the same generated DOM structure on both the server and the client. The hydration process expects the DOM tree to have the same structure in both environments, including whitespaces and comment nodes produced during server-side rendering.

Direct DOM Manipulation

The fact that server and client DOM structures must match means that components that manipulate the DOM using native DOM APIs or use innerHTML or outerHTML will encounter hydration errors. The errors are thrown because Angular is unaware of these changes and cannot resolve them during hydration. Examples include accessing the document, querying for specific elements, and injecting additional nodes using appendChild. Detaching DOM nodes and moving them to other locations will also cause errors.

Direct DOM manipulation is generally considered bad practice in Angular, so I recommend refactoring your components to avoid it regardless of hydration. However, in warranted cases where refactoring is not feasible, you can use the ngSkipHydration attribute until a hydration-friendly solution can be implemented.

You can use it directly in a template:

<app-example ngSkipHydration></app-example>

or as a host binding:

@Component({
  ...
  host: {ngSkipHydration: 'true'},
})
class ExampleComponent {}

Note: The ngSkipHydration attribute forces Angular to skip hydrating the entire component and its children. So use this attribute carefully, as, for example, applying it to your root application component would effectively disable hydration for the entire application.

Valid HTML Structure

Another constraint is that invalid HTML structures in component templates can result in DOM mismatch errors during hydration. Common issues include:

  • <table> without a <tbody>
  • <div> inside a <p>
  • <a> inside an <h1>
  • <a> inside another <a>

Again, if you have an invalid HTML, you should fix this regardless of hydration. If you are unsure about your HTML's validity, you can use the W3 validator to check it.

Zoneless apps or custom Zone.js

Hydration relies on a signal from Zone.js when it becomes stable. Custom or "noop" Zone.js implementations may thus disrupt the timing of this event, triggering the serialization or cleanup process too early or too late. This configuration is not yet fully supported.

While Zoneless is already available in developer preview and we could assume this issue will be resolved when it lands as stable, there is no explicit ETA mentioned in the official roadmap.

I18n

One of the biggest blockers for adoption of client hydration was the lack of support for internationalization with hydration. By default, Angular 17 skipped hydration for components that used i18n blocks, re-rendering them from scratch. In Angular 18, however, hydration for i18n blocks got into developer preview.

To enable hydration for i18n blocks, you can add withI18nSupport to your provideClientHydration call.

import {
  bootstrapApplication,
  provideClientHydration,
  withI18nSupport,
} from '@angular/platform-browser';

bootstrapApplication(AppComponent, {
  providers: [provideClientHydration(withI18nSupport())]
});

Third-Party Libraries with DOM Manipulation

The last thing to consider is third-party libraries that manipulate DOM, such as D3 charts. They could cause DOM mismatch errors when hydration is enabled. You can use the ngSkipHydration attribute to skip hydration for components rendered using these libraries.

Conclusion

The Angular team has been doing great work to make the framework more modern and competitive, hearing the community feedback and adjusting the roadmap accordingly. And SSR is an excellent example of that. With the introduction of non-destructive hydration in Angular 16 and making it stable in Angular 17, the Angular team has taken a significant step forward in making SSR a first-class citizen in Angular. The @angular/ssr package is now part of the Angular CLI, making adding SSR to your Angular application easier. The Angular team plans to make SSR the default in the next version, further solidifying its position in the Angular ecosystem.

However, as with any new feature, there are some constraints and best practices to follow when using SSR with Angular. You should be aware of hydration's limitations and ensure your application is compatible with it. However, if you follow the guidelines provided by the Angular team, you should be able to take advantage of the benefits of SSR without any significant issues.

This Dot is a consultancy dedicated to guiding companies through their modernization and digital transformation journeys. Specializing in replatforming, modernizing, and launching new initiatives, we stand out by taking true ownership of your engineering projects.

We love helping teams with projects that have missed their deadlines or helping keep your strategic digital initiatives on course. Check out our case studies and our clients that trust us with their engineering.

You might also like

The Importance of a Scientific Mindset in Software Engineering: Part 2 (Debugging) cover image

The Importance of a Scientific Mindset in Software Engineering: Part 2 (Debugging)

The Importance of a Scientific Mindset in Software Engineering: Part 2 (Debugging) In the first part of my series on the importance of a scientific mindset in software engineering, we explored how the principles of the scientific method can help us evaluate sources and make informed decisions. Now, we will focus on how these principles can help us tackle one of the most crucial and challenging tasks in software engineering: debugging. In software engineering, debugging is often viewed as an art - an intuitive skill honed through experience and trial and error. In a way, it is - the same as a GP, even a very evidence-based one, will likely diagnose most of their patients based on their experience and intuition and not research scientific literature every time; a software engineer will often rely on their experience and intuition to identify and fix common bugs. However, an internist faced with a complex case will likely not be able to rely on their intuition alone and must apply the scientific method to diagnose the patient. Similarly, a software engineer can benefit from using the scientific method to identify and fix the problem when faced with a complex bug. From that perspective, treating engineering challenges like scientific inquiries can transform the way we tackle problems. Rather than resorting to guesswork or gut feelings, we can apply the principles of the scientific method—forming hypotheses, designing controlled experiments, gathering and evaluating evidence—to identify and eliminate bugs systematically. This approach, sometimes referred to as "scientific debugging," reframes debugging from a haphazard process into a structured, disciplined practice. It encourages us to be skeptical, methodical, and transparent in our reasoning. For instance, as Andreas Zeller notes in the book _Why Programs Fail_, the key aspect of scientific debugging is its explicitness: Using the scientific method, you make your assumptions and reasoning explicit, allowing you to understand your assumptions and often reveals hidden clues that can lead to the root cause of the problem on hand. Note: If you'd like to read an excerpt from the book, you can find it on Embedded.com. Scientific Debugging At its core, scientific debugging applies the principles of the scientific method to the process of finding and fixing software defects. Rather than attempting random fixes or relying on intuition, it encourages engineers to move systematically, guided by data, hypotheses, and controlled experimentation. By adopting debugging as a rigorous inquiry, we can reduce guesswork, speed up the resolution process, and ensure that our fixes are based on solid evidence. Just as a scientist begins with a well-defined research question, a software engineer starts by identifying the specific symptom or error condition. For instance, if our users report inconsistencies in the data they see across different parts of the application, our research question could be: _"Under what conditions does the application display outdated or incorrect user data?"_ From there, we can follow a structured debugging process that mirrors the scientific method: - 1. Observe and Define the Problem: First, we need to clearly state the bug's symptoms and the environment in which it occurs. We should isolate whether the issue is deterministic or intermittent and identify any known triggers if possible. Such a structured definition serves as the groundwork for further investigation. - 2. Formulate a Hypothesis: A hypothesis in debugging is a testable explanation for the observed behavior. For instance, you might hypothesize: _"The data inconsistency occurs because a caching layer is serving stale data when certain user profiles are updated."_ The key is that this explanation must be falsifiable; if experiments don't support the hypothesis, it must be refined or discarded. - 3. Collect Evidence and Data: Evidence often includes logs, system metrics, error messages, and runtime traces. Similar to reviewing primary sources in academic research, treat your raw debugging data as crucial evidence. Evaluating these data points can reveal patterns. In our example, such patterns could be whether the bug correlates with specific caching mechanisms, increased memory usage, or database query latency. During this step, it's essential to approach data critically, just as you would analyze the quality and credibility of sources in a research literature review. Don't forget that even logs can be misleading, incomplete, or even incorrect, so cross-referencing multiple sources is key. - 4. Design and Run Experiments: Design minimal, controlled tests to confirm or refute your hypothesis. In our example, you may try disabling or shortening the cache's time-to-live (TTL) to see if more recent data is displayed correctly. By manipulating one variable at a time - such as cache invalidation intervals - you gain clearer insights into causation. Tools such as profilers, debuggers, or specialized test harnesses can help isolate factors and gather precise measurements. - 5. Analyze Results and Refine Hypotheses: If the experiment's outcome doesn't align with your hypothesis, treat it as a stepping stone, not a dead end. Adjust your explanation, form a new hypothesis, or consider additional variables (for example, whether certain API calls bypass caching). Each iteration should bring you closer to a better understanding of the bug's root cause. Remember, the goal is not to prove an initial guess right but to arrive at a verifiable explanation. - 6. Implement and Verify the Fix: Once you're confident in the identified cause, you can implement the fix. Verification doesn't stop at deployment - re-test under the same conditions and, if possible, beyond them. By confirming the fix in a controlled manner, you ensure that the solution is backed by evidence rather than wishful thinking. - Personally, I consider implementing end-to-end tests (e.g., with Playwright) that reproduce the bug and verify the fix to be a crucial part of this step. This both ensures that the bug doesn't reappear in the future due to changes in the codebase and avoids possible imprecisions of manual testing. Now, we can explore these steps in more detail, highlighting how the scientific method can guide us through the debugging process. Establishing Clear Debugging Questions (Formulating a Hypothesis) A hypothesis is a proposed explanation for a phenomenon that can be tested through experimentation. In a debugging context, that phenomenon is the bug or issue you're trying to resolve. Having a clear, falsifiable statement that you can prove or disprove ensures that you stay focused on the real problem rather than jumping haphazardly between possible causes. A properly formulated hypothesis lets you design precise experiments to evaluate whether your explanation holds true. To formulate a hypothesis effectively, you can follow these steps: 1. Clearly Identify the Symptom(s) Before forming any hypothesis, pin down the specific issue users are experiencing. For instance: - "Users intermittently see outdated profile information after updating their accounts." - "Some newly created user profiles don't reflect changes in certain parts of the application." Having a well-defined problem statement keeps your hypothesis focused on the actual issue. Just like a research question in science, the clarity of your symptom definition directly influences the quality of your hypothesis. 2. Draft a Tentative Explanation Next, convert your symptom into a statement that describes a _possible root cause_, such as: - "Data inconsistency occurs because the caching layer isn't invalidating or refreshing user data properly when profiles are updated." - "Stale data is displayed because the cache timeout is too long under certain load conditions." This step makes your assumption about the root cause explicit. As with the scientific method, your hypothesis should be something you can test and either confirm or refute with data or experimentation. 3. Ensure Falsifiability A valid hypothesis must be falsifiable - meaning it can be proven _wrong_. You'll struggle to design meaningful experiments if a hypothesis is too vague or broad. For example: - Not Falsifiable: "Occasionally, the application just shows weird data." - Falsifiable: "Users see stale data when the cache is not invalidated within 30 seconds of profile updates." Making your hypothesis specific enough to fail a test will pave the way for more precise debugging. 4. Align with Available Evidence Match your hypothesis to what you already know - logs, stack traces, metrics, and user reports. For example: - If logs reveal that cache invalidation events aren't firing, form a hypothesis explaining why those events fail or never occur. - If metrics show that data served from the cache is older than the configured TTL, hypothesize about how or why the TTL is being ignored. If your current explanation contradicts existing data, refine your hypothesis until it fits. 5. Plan for Controlled Tests Once you have a testable hypothesis, figure out how you'll attempt to _disprove_ it. This might involve: - Reproducing the environment: Set up a staging/local system that closely mimics production. For instance with the same cache layer configurations. - Varying one condition at a time: For example, only adjust cache invalidation policies or TTLs and then observe how data freshness changes. - Monitoring metrics: In our example, such monitoring would involve tracking user profile updates, cache hits/misses, and response times. These metrics should lead to confirming or rejecting your explanation. These plans become your blueprint for experiments in further debugging stages. Collecting and Evaluating Evidence After formulating a clear, testable hypothesis, the next crucial step is to gather data that can either support or refute it. This mirrors how scientists collect observations in a literature review or initial experiments. 1. Identify "Primary Sources" (Logs, Stack Traces, Code History): - Logs and Stack Traces: These are your direct pieces of evidence - treat them like raw experimental data. For instance, look closely at timestamps, caching-related events (e.g., invalidation triggers), and any error messages related to stale reads. - Code History: Look for related changes in your source control, e.g. using Git bisect. In our example, we would look for changes to caching mechanisms or references to cache libraries in commits, which could pinpoint when the inconsistency was introduced. Sometimes, reverting a commit that altered cache settings helps confirm whether the bug originated there. 2. Corroborate with "Secondary Sources" (Documentation, Q&A Forums): - Documentation: Check official docs for known behavior or configuration details that might differ from your assumptions. - Community Knowledge: Similar issues reported on GitHub or StackOverflow may reveal known pitfalls in a library you're using. 3. Assess Data Quality and Relevance: - Look for Patterns: For instance, does stale data appear only after certain update frequencies or at specific times of day? - Check Environmental Factors: For instance, does the bug happen only with particular deployment setups, container configurations, or memory constraints? - Watch Out for Biases: Avoid seeking only the data that confirms your hypothesis. Look for contradictory logs or metrics that might point to other root causes. You keep your hypothesis grounded in real-world system behavior by treating logs, stack traces, and code history as primary data - akin to raw experimental results. This evidence-first approach reduces guesswork and guides more precise experiments. Designing and Running Experiments With a hypothesis in hand and evidence gathered, it's time to test it through controlled experiments - much like scientists isolate variables to verify or debunk an explanation. 1. Set Up a Reproducible Environment: - Testing Environments: Replicate production conditions as closely as possible. In our example, that would involve ensuring the same caching configuration, library versions, and relevant data sets are in place. - Version Control Branches: Use a dedicated branch to experiment with different settings or configuration, e.g., cache invalidation strategies. This streamlines reverting changes if needed. 2. Control Variables One at a Time: - For instance, if you suspect data inconsistency is tied to cache invalidation events, first adjust only the invalidation timeout and re-test. - Or, if concurrency could be a factor (e.g., multiple requests updating user data simultaneously), test different concurrency levels to see if stale data issues become more pronounced. 3. Measure and Record Outcomes: - Automated Tests: Tests provide a great way to formalize and verify your assumptions. For instance, you could develop tests that intentionally update user profiles and check if the displayed data matches the latest state. - Monitoring Tools: Monitor relevant metrics before, during, and after each experiment. In our example, we might want to track cache hit rates, TTL durations, and query times. - Repeat Trials: Consistency across multiple runs boosts confidence in your findings. 4. Validate Against a Baseline: - If baseline tests manifest normal behavior, but your experimental changes manifest the bug, you've isolated the variable causing the issue. E.g. if the baseline tests show that data is consistently fresh under normal caching conditions but your experimental changes cause stale data. - Conversely, if your change eliminates the buggy behavior, it supports your hypothesis - e.g. that the cache configuration was the root cause. Each experiment outcome is a data point supporting or contradicting your hypothesis. Over time, these data points guide you toward the true cause. Analyzing Results and Iterating In scientific debugging, an unexpected result isn't a failure - it's valuable feedback that brings you closer to the right explanation. 1. Compare Outcomes to the hypothesis. For instance: - Did user data stay consistent after you reduced the cache TTL or fixed invalidation logic? - Did logs show caching events firing as expected, or did they reveal unexpected errors? - Are there only partial improvements that suggest multiple overlapping issues? 2. Incorporate Unexpected Observations: - Sometimes, debugging uncovers side effects - e.g. performance bottlenecks exposed by more frequent cache invalidations. Note these for future work. - If your hypothesis is disproven, revise it. For example, the cache may only be part of the problem, and a separate load balancer setting also needs attention. 3. Avoid Confirmation Bias: - Don't dismiss contrary data. For instance, if you see evidence that updates are fresh in some modules but stale in others, you may have found a more nuanced root cause (e.g., partial cache invalidation). - Consider other credible explanations if your teammates propose them. Test those with the same rigor. 4. Decide If You Need More Data: - If results aren't conclusive, add deeper instrumentation or enable debug modes to capture more detailed logs. - For production-only issues, implement distributed tracing or sampling logs to diagnose real-world usage patterns. 5. Document Each Iteration: - Record the results of each experiment, including any unexpected findings or new hypotheses that arise. - Through iterative experimentation and analysis, each cycle refines your understanding. By letting evidence shape your hypothesis, you ensure that your final conclusion aligns with reality. Implementing and Verifying the Fix Once you've identified the likely culprit - say, a misconfigured or missing cache invalidation policy - the next step is to implement a fix and verify its resilience. 1. Implementing the Change: - Scoped Changes: Adjust just the component pinpointed in your experiments. Avoid large-scale refactoring that might introduce other issues. - Code Reviews: Peer reviews can catch overlooked logic gaps or confirm that your changes align with best practices. 2. Regression Testing: - Re-run the same experiments that initially exposed the issue. In our stale data example, confirm that the data remains fresh under various conditions. - Conduct broader tests - like integration or end-to-end tests - to ensure no new bugs are introduced. 3. Monitoring in Production: - Even with positive test results, real-world scenarios can differ. Monitor logs and metrics (e.g. cache hit rates, user error reports) closely post-deployment. - If the buggy behavior reappears, revisit your hypothesis or consider additional factors, such as unpredicted user behavior. 4. Benchmarking and Performance Checks (If Relevant): - When making changes that affect the frequency of certain processes - such as how often a cache is refreshed - be sure to measure the performance impact. Verify you meet any latency or resource usage requirements. - Keep an eye on the trade-offs: For instance, more frequent cache invalidations might solve stale data but could also raise system load. By systematically verifying your fix - similar to confirming experimental results in research - you ensure that you've addressed the true cause and maintained overall software stability. Documenting the Debugging Process Good science relies on transparency, and so does effective debugging. Thorough documentation guarantees your findings are reproducible and valuable to future team members. 1. Record Your Hypothesis and Experiments: - Keep a concise log of your main hypothesis, the tests you performed, and the outcomes. - A simple markdown file within the repo can capture critical insights without being cumbersome. 2. Highlight Key Evidence and Observations: - Note the logs or metrics that were most instrumental - e.g., seeing repeated stale cache hits 10 minutes after updates. - Document any edge cases discovered along the way. 3. List Follow-Up Actions or Potential Risks: - If you discover additional issues - like memory spikes from more frequent invalidation - note them for future sprints. - Identify parts of the code that might need deeper testing or refactoring to prevent similar issues. 4. Share with Your Team: - Publish your debugging report on an internal wiki or ticket system. A well-documented troubleshooting narrative helps educate other developers. - Encouraging open discussion of the debugging process fosters a culture of continuous learning and collaboration. By paralleling scientific publication practices in your documentation, you establish a knowledge base to guide future debugging efforts and accelerate collective problem-solving. Conclusion Debugging can be as much a rigorous, methodical exercise as an art shaped by intuition and experience. By adopting the principles of scientific inquiry - forming hypotheses, designing controlled experiments, gathering evidence, and transparently documenting your process - you make your debugging approach both systematic and repeatable. The explicitness and structure of scientific debugging offer several benefits: - Better Root-Cause Discovery: Structured, hypothesis-driven debugging sheds light on the _true_ underlying factors causing defects rather than simply masking symptoms. - Informed Decisions: Data and evidence lead the way, minimizing guesswork and reducing the chance of reintroducing similar issues. - Knowledge Sharing: As in scientific research, detailed documentation of methods and outcomes helps others learn from your process and fosters a collaborative culture. Ultimately, whether you are diagnosing an intermittent crash or chasing elusive performance bottlenecks, scientific debugging brings clarity and objectivity to your workflow. By aligning your debugging practices with the scientific method, you build confidence in your solutions and empower your team to tackle complex software challenges with precision and reliability. But most importantly, do not get discouraged by the number of rigorous steps outlined above or by the fact you won't always manage to follow them all religiously. Debugging is a complex and often frustrating process, and it's okay to rely on your intuition and experience when needed. Feel free to adapt the debugging process to your needs and constraints, and as long as you keep the scientific mindset at heart, you'll be on the right track....

Incremental Hydration in Angular cover image

Incremental Hydration in Angular

Incremental Hydration in Angular Some time ago, I wrote a post about SSR finally becoming a first-class citizen in Angular. It turns out that the Angular team really treats SSR as a priority, and they have been working tirelessly to make SSR even better. As the previous blog post mentioned, full-page hydration was launched in Angular 16 and made stable in Angular 17, providing a great way to improve your Core Web Vitals. Another feature aimed to help you improve your INP and other Core Web Vitals was introduced in Angular 17: deferrable views. Using the @defer blocks allows you to reduce the initial bundle size and defer the loading of heavy components based on certain triggers, such as the section entering the viewport. Then, in September 2024, the smart folks at Angular figured out that they could build upon those two features, allowing you to mark parts of your application to be server-rendered dehydrated and then hydrate them incrementally when needed - hence incremental hydration. I’m sure you know what hydration is. In short, the server sends fully formed HTML to the client, ensuring that the user sees meaningful content as quickly as possible and once JavaScript is loaded on the client side, the framework will reconcile the rendered DOM with component logic, event handlers, and state - effectively hydrating the server-rendered content. But what exactly does "dehydrated" mean, you might ask? Here's what will happen when you mark a part of your application to be incrementally hydrated: 1. Server-Side Rendering (SSR): The content marked for incremental hydration is rendered on the server. 2. Skipped During Client-Side Bootstrapping: The dehydrated content is not initially hydrated or bootstrapped on the client, reducing initial load time. 3. Dehydrated State: The code for the dehydrated components is excluded from the initial client-side bundle, optimizing performance. 4. Hydration Triggers: The application listens for specified hydration conditions (e.g., on interaction, on viewport), defined with a hydrate trigger in the @defer block. 5. On-Demand Hydration: Once the hydration conditions are met, Angular downloads the necessary code and hydrates the components, allowing them to become interactive without layout shifts. How to Use Incremental Hydration Thanks to Mark Thompson, who recently hosted a feature showcase on incremental hydration, we can show some code. The first step is to enable incremental hydration in your Angular application's appConfig using the provideClientHydration provider function: ` Then, you can mark the components you want to be incrementally hydrated using the @defer block with a hydrate trigger: ` And that's it! You now have a component that will be server-rendered dehydrated and hydrated incrementally when it becomes visible to the user. But what if you want to hydrate the component on interaction or some other trigger? Or maybe you don't want to hydrate the component at all? The same triggers already supported in @defer blocks are available for hydration: - idle: Hydrate once the browser reaches an idle state. - viewport: Hydrate once the component enters the viewport. - interaction: Hydrate once the user interacts with the component through click or keydown triggers. - hover: Hydrate once the user hovers over the component. - immediate: Hydrate immediately when the component is rendered. - timer: Hydrate after a specified time delay. - when: Hydrate when a provided conditional expression is met. And on top of that, there's a new trigger available for hydration: - never: When used, the component will remain static and not hydrated. The never trigger is handy when you want to exclude a component from hydration altogether, making it a completely static part of the page. Personally, I'm very excited about this feature and can't wait to try it out. How about you?...

The Importance of a Scientific Mindset in Software Engineering: Part 1 (Source Evaluation & Literature Review) cover image

The Importance of a Scientific Mindset in Software Engineering: Part 1 (Source Evaluation & Literature Review)

The Importance of a Scientific Mindset in Software Engineering: Part 1 (Source Evaluation & Literature Review) Today, I will write about something very dear to me - science. But not about science as a field of study but rather as a way of thinking. It's easy nowadays to get lost in the sea of information, fall for marketing hype, or even be trolled by a hallucinating LLM. A scientific mindset can be a powerful tool for navigating the complex modern world and the world of software engineering in particular. Not only is it a powerful tool, but I'll argue that it's a must nowadays if you want to make informed decisions, solve problems effectively, and become a better engineer. As software engineers, we are constantly confronted with an overwhelming array of frameworks, technologies, and infrastructure choices. Sometimes, it feels like there's a new tool or platform every day, each accompanied by its own wave of hype and marketing. It's easy to feel lost in the myriad of information or even suffer from FOMO and insecurity about not jumping on the latest bandwagon. But it's not only about the abundance of information and making technological decisions. As engineers, we often write documentation, blog posts, talks, or even books. We need to be able to communicate our ideas clearly and effectively. Furthermore, we have to master the art of debugging code, which is essentially a scientific process where we form hypotheses, test them, and iterate until we find the root cause of the problem. Therefore, here's my hot take: engineering is a science; hence, to deserve an engineer title, one needs to think like a scientist. So, let's _review_ (pun intended) what it means to think like a scientist in the context of software engineering. Systematic Review In science, systematic review is not only an essential means to understand a topic and map the current state of knowledge in the field, but it also has a well-defined methodology. You can't just google whatever supports your hypothesis and call it a day. You must define your research question, choose the databases you will search, set your inclusion and exclusion criteria, systematically search for relevant studies, evaluate their quality, and synthesize the results. Most importantly, you must be transparent about and describe your methodology in detail. The general process of systematic review can be summarized in the following steps: 1. Define your research question(s) 2. Choose databases and other sources to search 3. Define keywords and search terms 4. Define inclusion and exclusion criteria a. Define practical criteria such as publication date, language, etc. b. Define methodological criteria such as study design, sample size, etc. 5. Search for relevant studies 6. Evaluate the quality of the studies 7. Synthesize the results Source: Conducting Research Literature Reviews: From the Internet to Paper by Dr. Fink I'm pretty sure you can see where I'm going with this. There are many use cases in software engineering where a process similar to systematic review can be applied. Whether you're evaluating a new technology, choosing a tech stack for a new project, or researching for a blog post or a conference talk, it's important to be systematic in your approach, transparent about your methodology, and honest about the limitations of your research. Of course, when choosing a tech stack to learn or researching for a blog post, you don't have to be as rigorous as in a scientific study. But a few of these steps will always be worth following. Let's focus on those and see how we can apply them in the context of software engineering. Defining Your Research Question(s) Before you start researching, it's important to define your research questions. What are you trying to find out? What problem are you trying to solve? What are the goals of your research? These questions will help you stay focused and avoid focusing on irrelevant information. > A practical example: If you're evaluating, say, whether to use bundler _A_ or bundler _B_ without a clear research question, you might end up focusing on marketing claims about how bundler _A_ is faster than bundler _B_ or how bundler _B_ is more popular than bundler _A_, even though such aspects may have minimal impact on your project. With a clear research question, you can focus on what really matters for your project, like how well each bundler integrates with your existing tools, how well they handle your specific use case, or how well they are maintained. A research question is not a hypothesis - you don't have to have a clear idea of the answer. It's more about defining the scope of your research and setting clear goals. It can be as simple and general as "What are the pros and cons of using React vs. Angular for a particular project?" but also more specific and focused, like "What are the legal implications of using open-source library _X_ for purpose _Y_ in project _Z_?". You can have multiple research questions, but keeping them focused and relevant to your goals is essential. In my personal opinion, part of the scientific mindset is automatically having at least a vague idea of a research question in your head whenever you're facing a problem or a decision, and that alone can make you a more confident and effective engineer. Choosing Databases and Other Sources to Search In engineering, some information (especially when researching rare bugs) can be scarce, and you have to search wherever and take what you can get. Hence, this step is arguably much easier in science, where you can include well-established databases and publications in your search. Information in science is simply more standardized and easier to find. There are, however, still some decisions to be made about where to search. Do you want to include community websites like StackOverflow or Reddit? Do you want to include marketing materials from the companies behind the technologies you're evaluating? These can all be valid sources of information, but they have their limitations and biases, and it's important to be aware of them. Or do you want to ask a LLM? I hadn't included LLMs in the list of valid sources of information on purpose as they are not literature databases in the traditional sense, and I wouldn't consider them a search source for literature research. And for a very good reason - they are essentially a black box, and therefore, you cannot reliably describe a reproducible methodology of your search. That doesn't mean you shouldn't ask an LLM for inspiration or a TL;DR, but you should always verify the information you get from them and be aware of their limitations. Defining Keywords and Search Terms This section will be short, as most of you are familiar with the concept of keywords and search terms and how to use search engines. However, I still wanted to highlight the importance of knowing how to search effectively for a software engineer. It's not just about typing in a few keywords and hoping for the best. It's about learning how to use advanced search operators, filter out irrelevant results, and find the information you need quickly and efficiently. If you're not familiar with advanced search operators, I highly recommend you take some time to learn them, for example, at FreeCodeCamp. Please note, however, that the article is specific to Google and different search engines may have different operators and syntax. This is especially true for scientific databases, which often have their own search syntax and operators. So, if you're doing more formal research, familiarize yourself with the database's search syntax. The underlying principles, however, are pretty much the same everywhere; just the syntax and UI might differ. With a solid search strategy in place, the next critical step is to assess the quality of the information we find. Methodological Criteria and Evaluation of Sources This is where things get interesting. In science, evaluating the quality of the studies is a crucial step in the systematic review process. You can't just take the results of a study at face value - you need to critically evaluate its design, the sample size, the methodology, and the conclusions - and you need to be aware of the limitations of the study and the potential biases that may have influenced the results. In science, there is a pretty straightforward yet helpful categorization of sources that my students surprisingly needed help understanding because no one ever explained it to them. So let me lay out and explain the three categories to you now: 1. Primary sources Primary sources represent original research. You can find them in studies, conference papers, etc. In science, this is what you generally want to cite in your own research. However, remember that only some of what you find in an original research paper is a primary source. Only the parts that present the original research are primary sources. For example, the introduction can contain citations to other studies, which are not primary, but secondary sources. While primary sources can sometimes be perceived as hard to read and understand, in many cases, they can actually be easier to reach and understand as the methods and results are usually presented in a condensed form in the abstract, and often you can only skim the introduction and discussion to get a good idea of the study. In software engineering, primary sources can sometimes be papers, but more often, they are original documentation, case studies, or even blog posts that present original research or data. For example, if you're evaluating a new technology, the official documentation, case studies, and blog posts from its developers can be considered primary sources. 2. Secondary sources Secondary sources are typically reviews, meta-analyses, and other sources that summarize, analyze, or reference the primary sources. A good way to identify a source as secondary is to look for citations to other studies. If a claim has a citation, it's likely a secondary source. On the other hand, something is likely wrong if it doesn't have a citation and doesn't seem to present original research. Secondary sources can be very useful for getting an overview of a topic, understanding the current state of knowledge, and finding relevant primary sources. Meta-analyses, in particular, can provide a beneficial point of view on a subject by combining the results of multiple studies and looking for patterns and trends. The downside of secondary sources is that they can introduce information noise, as they are basically introducing another layer of interpretation and analysis. So, it's always a good idea to go back to the primary sources and verify the information you get from secondary sources. Secondary sources in software engineering include blog posts, talks, or articles that summarize, analyze, or reference primary sources. For example, if you're researching a new technology, a blog post that compares different technologies based on their documentation and/or studies made by their authors can be considered a secondary source. 3. Tertiary sources Tertiary sources represent a further level of abstraction. They are typically textbooks, encyclopedias, and other sources that summarize, analyze, or reference secondary sources. They are useful for getting a broad overview of a topic, understanding the basic concepts, and finding relevant secondary sources. One example I see as a tertiary source is Wikipedia, and while you shouldn't ever cite Wikipedia in academic research, it can be a good starting point for getting an overview of a topic and finding relevant primary and secondary sources as you can easily click through the references. > Note: It's fine to reference Wikipedia in a blog post or a talk to give your audience a convenient explanation of a term or concept. I'm even doing it in this post. However, you should always verify that the article is up to date and that the information is correct. The distinction between primary, secondary, and tertiary sources in software engineering is not as clear-cut as in science, but the general idea still applies. When researching a topic, knowing the different types of sources and their limitations is essential. Primary sources are generally the most reliable and should be your go-to when seeking evidence to support your claims. Secondary sources can help get an overview of a topic, but they should be used cautiously, as they can introduce bias and noise. Tertiary sources are good for getting a broad overview of a topic but should not be used as evidence in academic research. Evaluating Sources Now that we have the categories laid out let's talk about evaluating the quality of the sources because, realistically, not all sources are created equal. In science, we have some well-established criteria for evaluating the quality of a source. Some focus on the general credibility of the source, like the reputation of the journal or the author. In contrast, others focus on the quality of the study itself, like the study design, the sample size, and the methodology. First, we usually look at the number of citations and the impact factor of the journal in which the study was published. These numbers can give us an idea of how well the scientific community received the study and how much other researchers have cited it. In software engineering, we don't have the concept of impact factor when it comes to researching a concept or a technology, but we can still look at how many people are sharing the particular piece of information and how well the professional community receives it and how reputable the person sharing the information is. Second, we look at the study design and the methodology. Does the study have a clear research question? Is the study design appropriate for the research question? Are the methods well-described and reproducible? Are the results presented clearly and honestly? Do the data support the conclusions? Arguably, in software engineering, the honest and clear presentation of the method and results can be even more important than in science, given the amounts of money circulating in the industry and the potential for conflicts of interest. Therefore, it's important to understand where the data is coming from, how it was collected, and how it was analyzed. If a company (or their DevRel person) is presenting data that show their product is the best (fastest, most secure...), it's important to be aware of the potential biases and conflicts of interest that may have influenced the results. The ways in which the results can be skewed may include: - Missing, incomplete, or inappropriate methodology. Often, the methodology is not described in enough detail to be reproducible, or the whole experiment is designed in a way that doesn't actually answer the research question properly. For example, the methodology can omit important details, such as the environment in which the experiment was conducted or even the way the data was collected (e.g., to hide selection bias). - Selection bias can be a common issue in software engineering experiments. For example, if someone is comparing two technologies, they might choose a dataset that they expect to perform better with one of the technologies or a metric that they expect to show a difference. Selection bias can lead to skewed results that don't reflect the technologies' real-world performance. - Publication bias is a common issue in science, where studies that show a positive result are more likely to be published than studies that show a negative outcome. In software engineering, this can manifest as a bias towards publishing success stories and case studies, while ignoring failures and negative results. - Confirmation bias is a problem in science and software engineering alike. It's the tendency to look for evidence that confirms your hypothesis and ignore evidence that contradicts it. Confirmation bias can lead to cherry-picking data, misinterpreting results, and drawing incorrect conclusions. - Conflict of interest. While less common in academic research, conflicts of interest can be a big issue in industry research. If a company is funding a study that shows its product in a positive light, it's important to be aware of the potential biases that may have influenced the results. Another thing we look at is the conclusions. Do the data support the conclusions? Are they reasonable and justified? Are they overstated or exaggerated? Are the limitations of the study acknowledged? Are the implications of the study discussed? It all goes back to honesty and transparency, which is crucial for evaluating the quality of the source. Last but not least, we should look at the citations and references included in the source. In the same way we apply the systematic review process to our research, we should also apply it to the sources we use. I would argue that this is even more important in software engineering, where the information is often less standardized, and you come across many unsupported claims. If a source doesn't provide citations or references to back up their claims, it's a red flag that the information may not be reliable. This brings us to something called anecdotal evidence. Anecdotal evidence is a personal story or experience used to support a claim. While anecdotal evidence can be compelling and persuasive, it is generally considered a weak form of evidence, as it is based on personal experience rather than empirical data. So when someone tells you that X is better than Y because they tried it and it worked for them, or that Z is true because they heard it from someone, take it with a massive grain of salt and look for more reliable sources of information. That, of course, doesn't mean you should ask for a source under every post on social media, but it's important to recognize what's a personal opinion and what's a claim based on evidence. Synthesizing the Results Once you have gathered all the relevant information, it's time to synthesize the results. This is where you combine all the evidence you have collected, analyze it, and draw conclusions. In science, this is often done as part of a meta-analysis, where the results of multiple studies are combined and analyzed to look for patterns and trends using statistical methods. A meta-analysis is a powerful tool for synthesizing the results of multiple studies and drawing more robust conclusions than can be drawn from any single study. You might not be doing a formal meta-analysis in software engineering, but you can still apply the same principles to your research. Look for common themes and trends in the information you have gathered, compare and contrast different sources, and draw conclusions based on the evidence. Conclusion Adopting a scientific way of thinking isn't just a nice-to-have in software engineering - it's essential to make informed decisions, solve problems effectively, and navigate the vast amount of information around you with confidence. Applying systematic review principles to your research allows you to gather reliable information, evaluate it critically, and draw sound conclusions based on evidence. Let's summarize what such a systematic research approach can look like: - Define Clear Research Questions: - Start every project or decision-making process by clearly stating what you aim to achieve or understand. - Example: "What factors should influence our choice between Cloud Service A and Cloud Service B for our application's specific needs?" - Critically Evaluate Sources: - Identify the type of sources (primary, secondary, tertiary) and assess their credibility. - Be wary of biases and seek out multiple perspectives for a well-rounded understanding. - Be Aware of Biases: - Recognize common biases that can cloud judgment, such as confirmation or selection bias. - Actively counteract these biases by seeking disconfirming evidence and questioning assumptions. - Systematically Synthesize Information: - Organize your findings and analyze them methodically. - Use tools and frameworks to compare options based on defined criteria relevant to your project's goals. I encourage you to embrace this scientific approach in your daily work. The next time you're facing a critical decision - be it selecting a technology stack, debugging complex code, or planning a project - apply these principles: - Start with a Question: Clearly define what you need to find out. - Gather and Evaluate Information: Seek out reliable sources and scrutinize them. - Analyze Systematically: Organize your findings and look for patterns or insights. - Make Informed Decisions: Choose the path supported by evidence and sound reasoning. By doing so, you will enhance your problem-solving skills and contribute to a culture of thoughtful, evidence-based practice in the software engineering community. The best part is that once you start applying a critical and systematic approach to your sources of information, it becomes second nature. You'll automatically start asking questions like, "Where did this information come from?" "Is it reliable?" and "Can I reproduce the results?" Doing so will make you much less susceptible to hype, marketing, and new shiny things, ultimately making you happier and more confident. In the next part of this series, we'll look at applying the scientific mindset to debugging and using hypothesis testing and experimentation principles to solve problems more effectively....

The simplicity of deploying an MCP server on Vercel cover image

The simplicity of deploying an MCP server on Vercel

The current Model Context Protocol (MCP) spec is shifting developers toward lightweight, stateless servers that serve as tool providers for LLM agents. These MCP servers communicate over HTTP, with OAuth handled clientside. Vercel’s infrastructure makes it easy to iterate quickly and ship agentic AI tools without overhead. Example of Lightweight MCP Server Design At This Dot Labs, we built an MCP server that leverages the DocuSign Navigator API. The tools, like `get_agreements`, make a request to the DocuSign API to fetch data and then respond in an LLM-friendly way. ` Before the MCP can request anything, it needs to guide the client on how to kick off OAuth. This involves providing some MCP spec metadata API endpoints that include necessary information about where to obtain authorization tokens and what resources it can access. By understanding these details, the client can seamlessly initiate the OAuth process, ensuring secure and efficient data access. The Oauth flow begins when the user's LLM client makes a request without a valid auth token. In this case they’ll get a 401 response from our server with a WWW-Authenticate header, and then the client will leverage the metadata we exposed to discover the authorization server. Next, the OAuth flow kicks off directly with Docusign as directed by the metadata. Once the client has the token, it passes it in the Authorization header for tool requests to the API. ` This minimal set of API routes enables me to fetch Docusign Navigator data using natural language in my agent chat interface. Deployment Options I deployed this MCP server two different ways: as a Fastify backend and then by Vercel functions. Seeing how simple my Fastify MCP server was, and not really having a plan for deployment yet, I was eager to rewrite it for Vercel. The case for Vercel: * My own familiarity with Next.js API deployment * Fit for architecture * The extremely simple deployment process * Deploy previews (the eternal Vercel customer conversion feature, IMO) Previews of unfamiliar territory Did you know that the MCP spec doesn’t “just work” for use as ChatGPT tooling? Neither did I, and I had to experiment to prove out requirements that I was unfamiliar with. Part of moving fast for me was just deploying Vercel previews right out of the CLI so I could test my API as a Connector in ChatGPT. This was a great workflow for me, and invaluable for the team in code review. Stuff I’m Not Worried About Vercel’s mcp-handler package made setup effortless by abstracting away some of the complexity of implementing the MCP server. It gives you a drop-in way to define tools, setup https-streaming, and handle Oauth. By building on Vercel’s ecosystem, I can focus entirely on shipping my product without worrying about deployment, scaling, or server management. Everything just works. ` A Brief Case for MCP on Next.js Building an API without Next.js on Vercel is straightforward. Though, I’d be happy deploying this as a Next.js app, with the frontend features serving as the documentation, or the tools being a part of your website's agentic capabilities. Overall, this lowers the barrier to building any MCP you want for yourself, and I think that’s cool. Conclusion I'll avoid quoting Vercel documentation in this post. AI tooling is a critical component of this natural language UI, and we just want to ship. I declare Vercel is excellent for stateless MCP servers served over http....

Let's innovate together!

We're ready to be your trusted technical partners in your digital innovation journey.

Whether it's modernization or custom software solutions, our team of experts can guide you through best practices and how to build scalable, performant software that lasts.

Prefer email? hi@thisdot.co