Skip to content

What is Cypress Studio?

What is Cypress Studio?

Introduction

Cypress Studio has been around for some time. It was introduced in Cypress v6.3.0, removed in v10, and reintroduced in v10.7.0. This blog post will dive into its current state and how to use it today.

What is Cypress Studio

Cypress Studio is a tool built on top of Cypress. It offers an interface for creating tests as if you were using your site without requiring code to be written. It adds functionality to query elements and to add assertions from the interface. It's important to note that Cypress Studio is still under an experimental flag and lacks support for Component Testing (another feature of Cypress).

Creating an app to test

We first need a working app because the tool we will use is meant for end-to-end tests. I'll pick Svelte and Vite for this demo, but you can choose any framework. Cypress is agnostic in that matter.

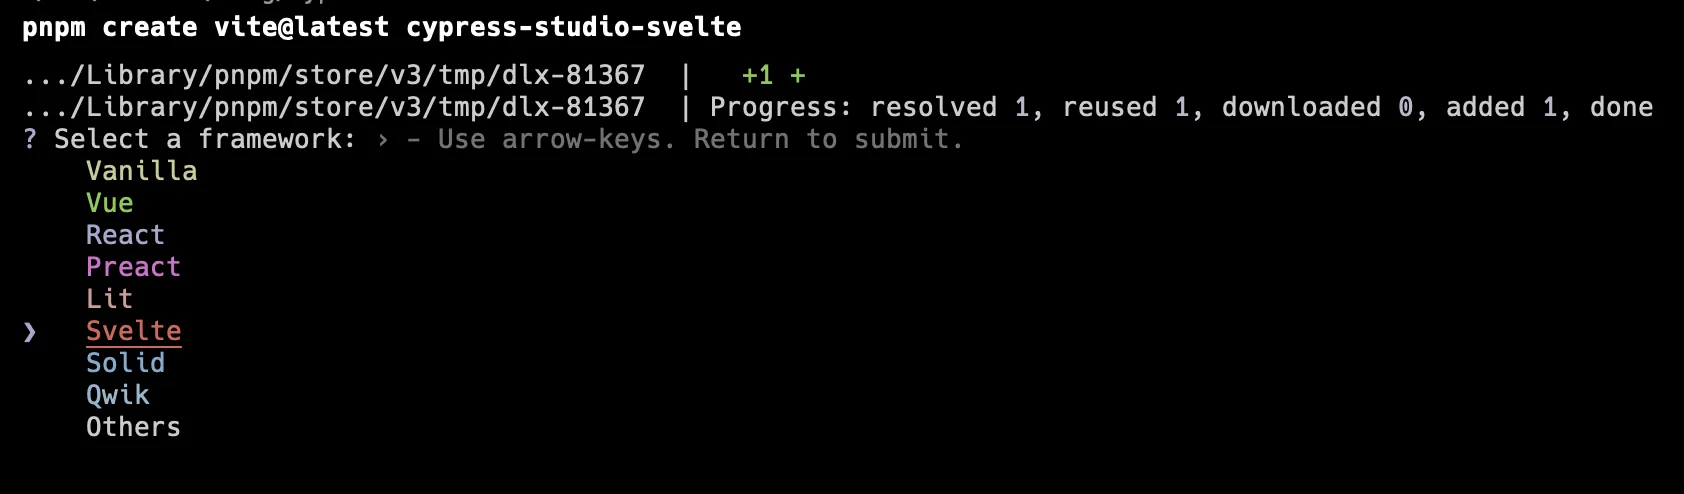
npm create vite@latest cypress-studio-svelte

Make sure to select the Svelte and Typescript options to follow along.

term-1terminal

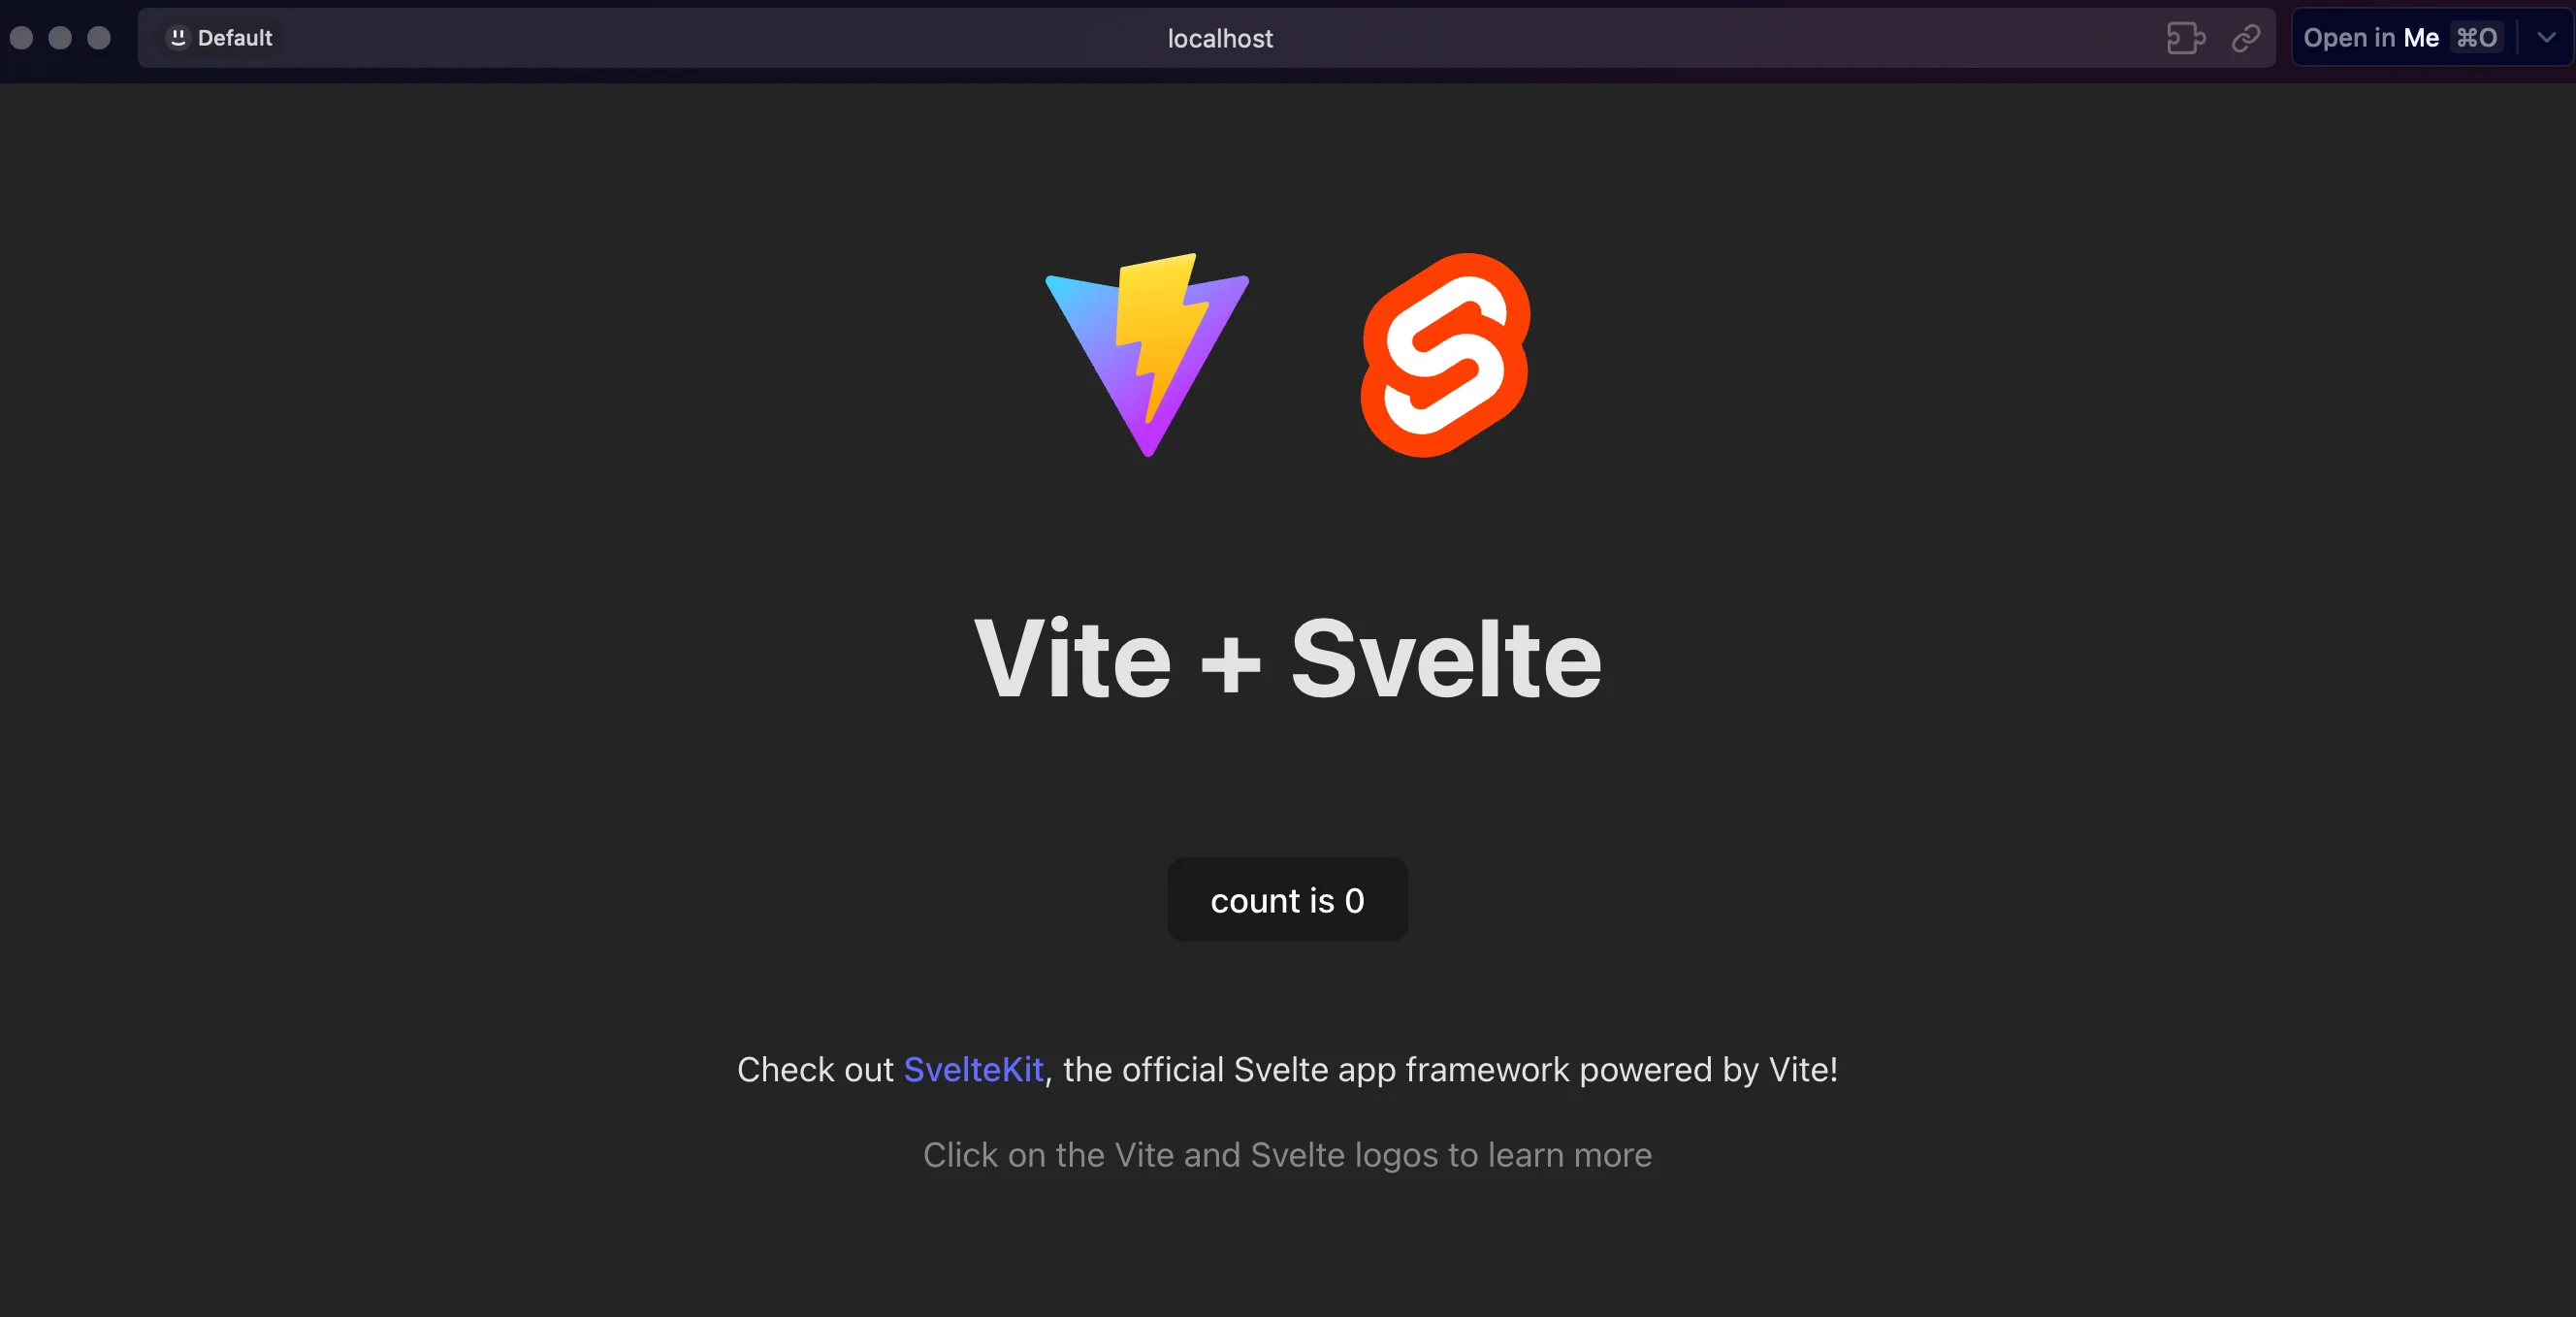
Now open your project location, install dependencies, and start your app to ensure everything works correctly.

cd cypress-studio-svelte
npm i
npm run dev --open
app

Installing and setting up Cypress Studio

Now it's time to add Cypress to our dev dependencies.

npm i -D cypress

With our dependency installed, let's launch it so we can start configuring it. But first let’s add an entry under scripts in our package.json file.

// ...
    "scripts": {
		// ...
		"cypress": "cypress"
	}
// ...
npm run cypress open

A new window will open that will guide us through the initial setup.

welcome to cypress

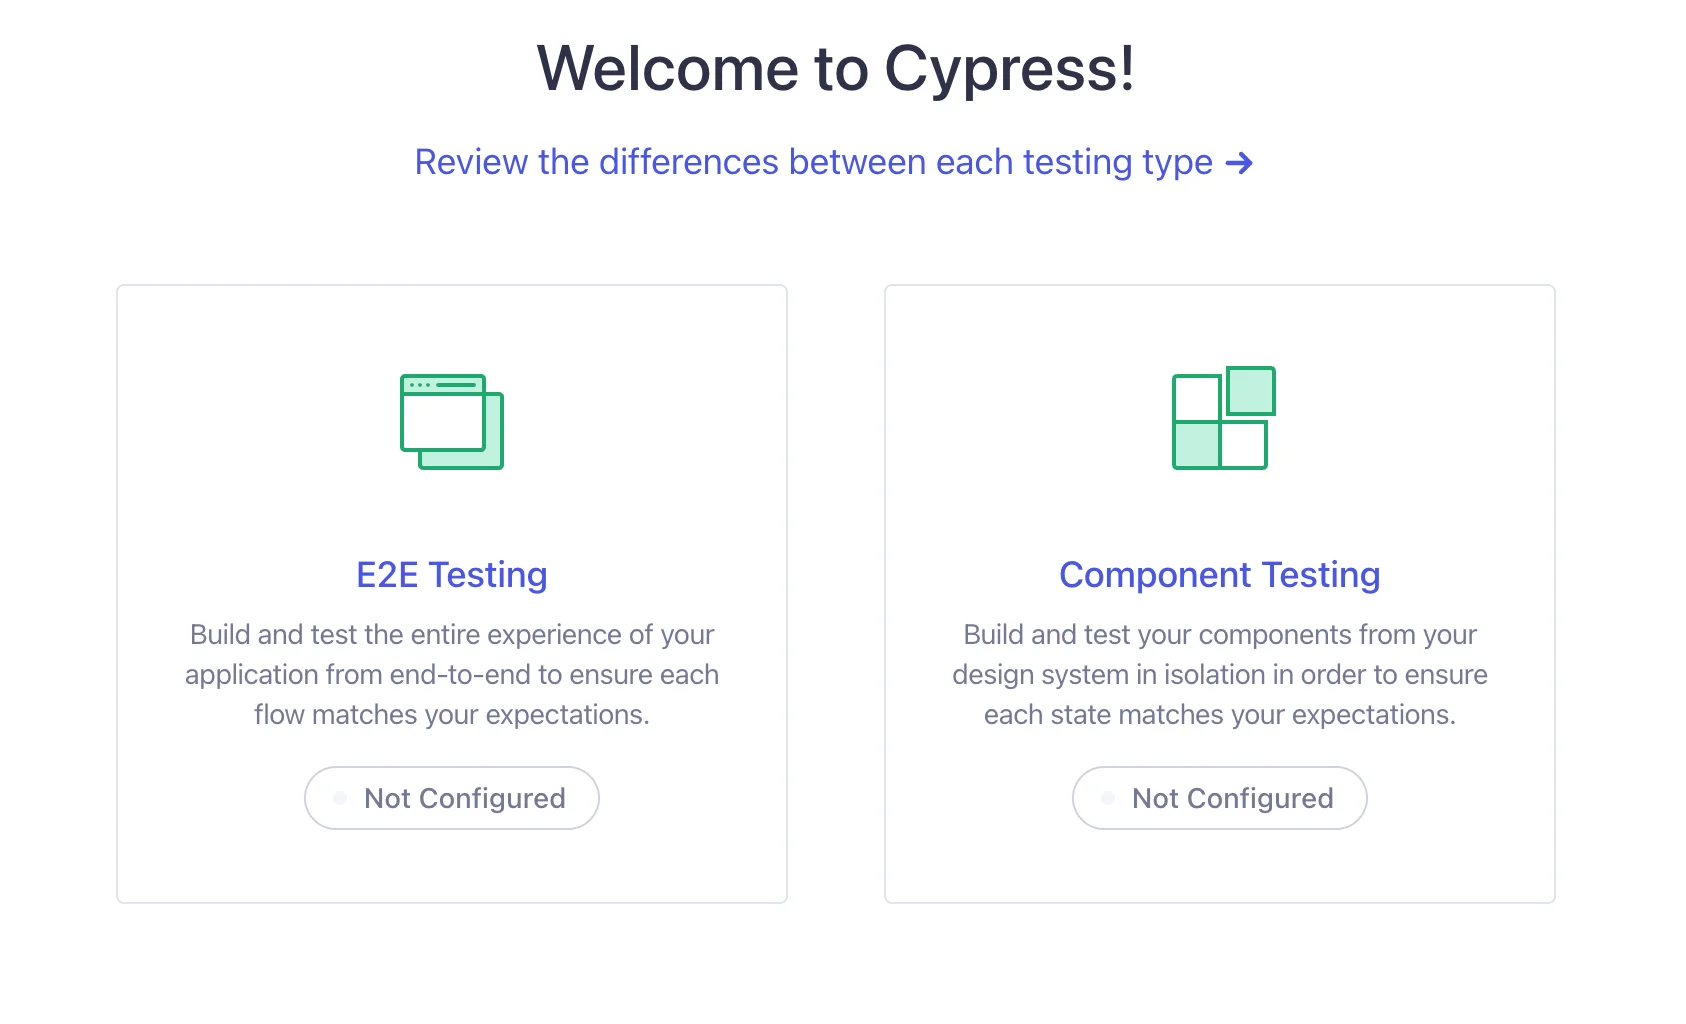
Select the "E2E Testing" option to create the required configuration files. Then, you can close the window. A new folder called cypress and a configuration file cypress.config.ts are created at the root of our project.

To enable Cypress Studio, we must open the newly created configuration file and add the experimentalStudio property.

import { defineConfig } from "cypress";

export default defineConfig({
  e2e: {
	experimentalStudio: true // add this option!
  },
});

For this project, we need to ensure that TypeScript is configured properly for Cypress when it runs, as it conflicts with the one in our root folder. We will extend the original typescript configuration and override some properties. Create a new tsconfig.json file inside the' cypress' folder.

{
    "extends": "../tsconfig.json",
    "include": [
      "../node_modules/cypress",
      "**/*.cy.ts"
    ],
    "exclude": [],
    "compilerOptions": {
      "noEmit": false,
      "sourceMap": false,
      "target": "es5",
      "lib": ["es5", "dom"],
      "types": ["cypress"]
    }
}

You can find more information on setting up TypeScript with Cypress in their documentation

Creating tests

Now that our setup is complete let's write our first test. We will create a folder called e2e and a new test file.

	mkdir cypress/e2e
	touch cypress/e2e/home.cy.ts

Open the new file and create an outline of your tests. Don't add anything to them. I initialized my file with a few tests.

describe("Home Page", () => {
    it("there's a button with a counter",  () => {

    });

    it("when clicking on the counter button, the count increases", ()=> {

    });

    it("when reloading the page, the count is reset to 0", () => {

    });
})

There is an option to create spec files from the interface, but it will contain some initial content that you most likely remove. There’s third option to scaffold multiple specs files, these can serve as a learning resource for writing tests as it contains many different scenarios tested.

Make sure your app is running and, in another terminal, start cypress.

npm run cypress open

Select E2E testing and Chrome. You should now see a list with all your test files.

cy-tests-list

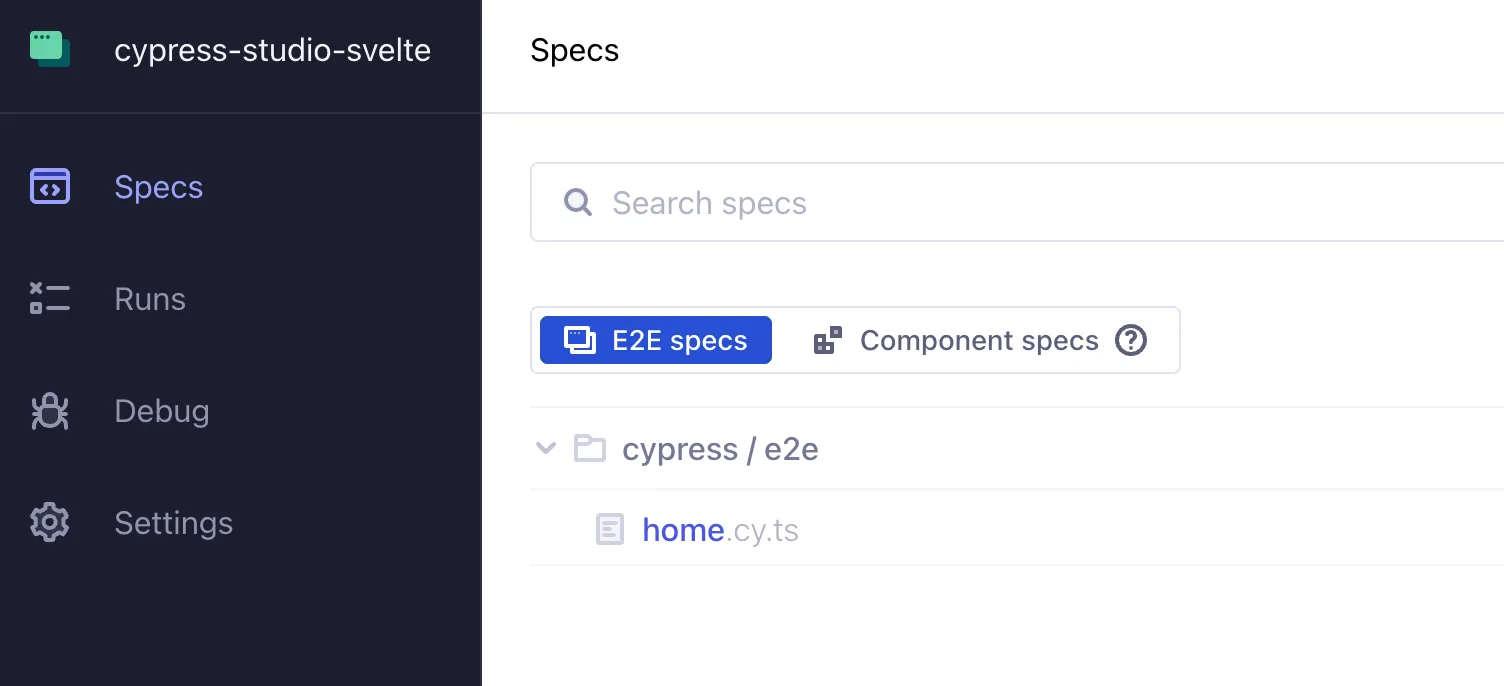
Click on home.cy.ts. Your tests will run and pass because we have not made any assertions.

green-no-assert

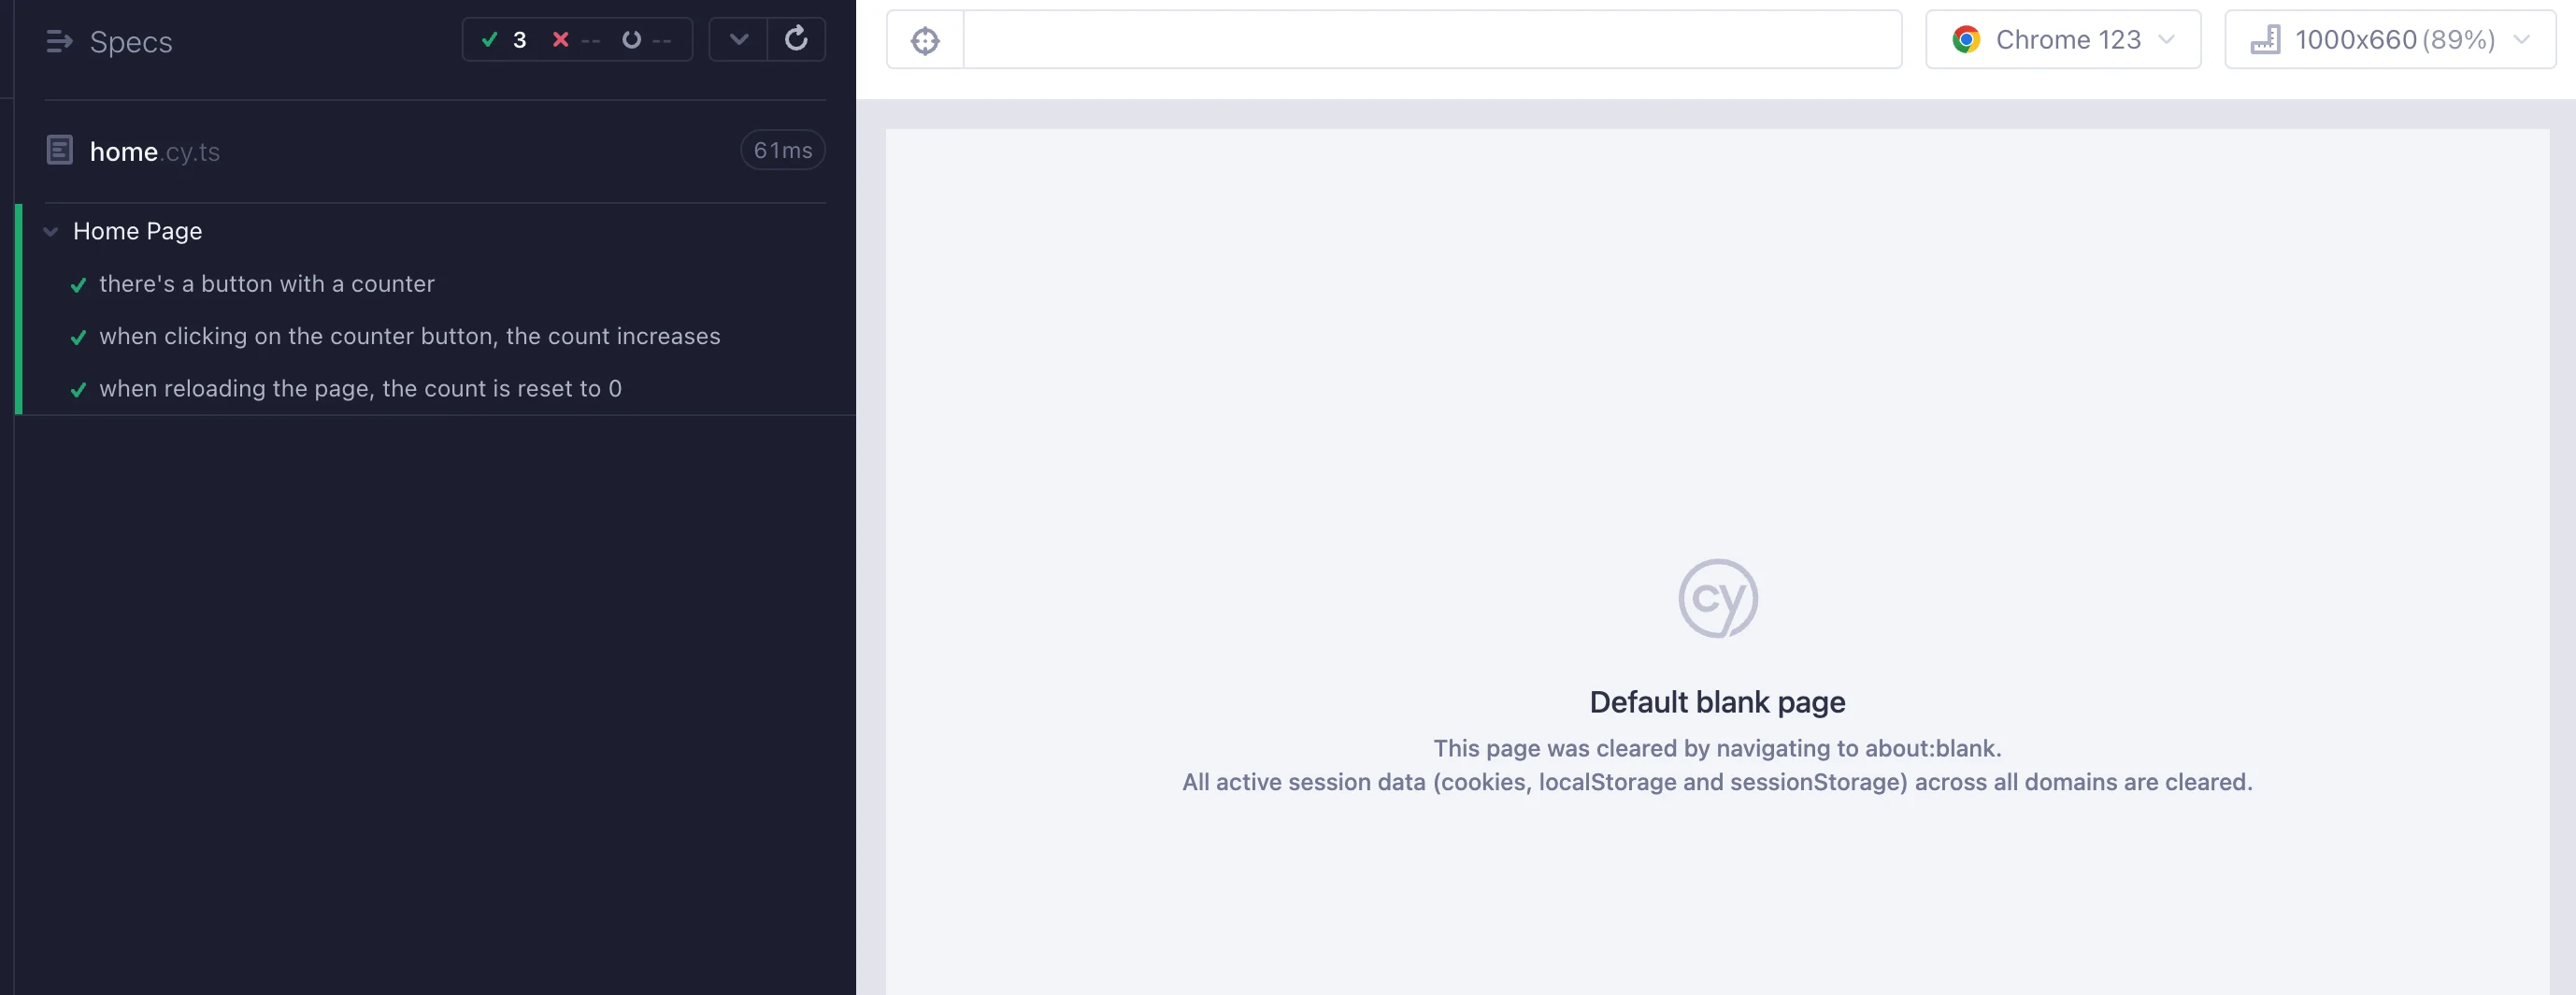
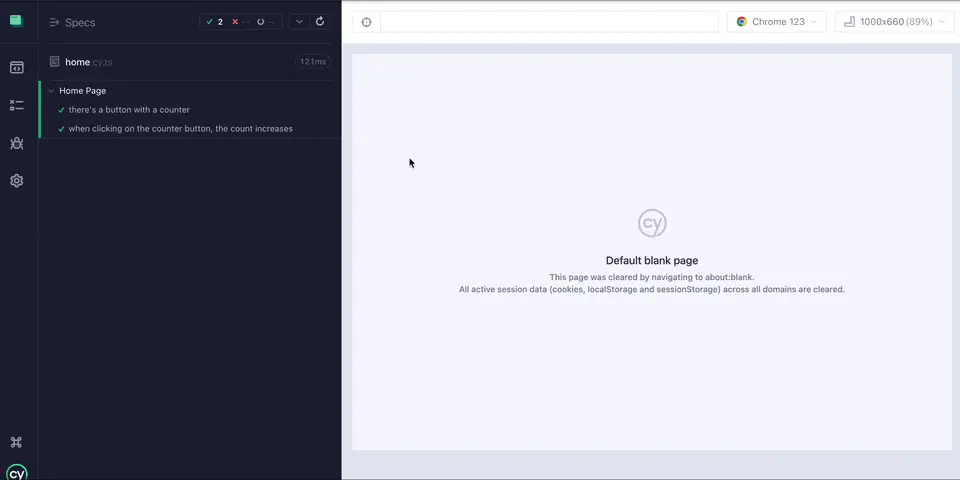
This looks the same as if we haven't enabled Studio, but there's a new detail added when you hover on any of the tests: a magic wand that you can click to start recording events and adding assertions directly in the UI.

Let's start with our first tests and check what assertions we can make. The first step is to navigate to a page. This interaction will be recorded and added to the test. To make assertions, right-click on an element and select the ones you want to add.

vid1

After we complete our test, let's review our generated code. Go to the test file and see the changes made to it. It should look something like this.

it("there's a button with a counter",  () => {
    /* ==== Generated with Cypress Studio ==== */
    cy.visit('localhost:5173/');
    cy.get('button').should('be.visible');
    cy.get('button').should('be.enabled');
    cy.get('button').should('have.text', 'count is 0');
    /* ==== End Cypress Studio ==== */
});

Cypress Studio will attempt to pick the best selector for the element. In this case, it was able to choose button because it is unique to the page. If there were more buttons, the selector would've been different.

You can interact with elements as if you were using the page regularly. Note that Studio supports a limited set of commands: check, click, select, type, and uncheck.

Let's record our second test and verify that the button will increase its count when clicked.

vid2

That was quick. Let's review our generated test.

 it("when clicking on the counter button, the count increases", ()=> {
    /* ==== Generated with Cypress Studio ==== */
    cy.visit('localhost:5173/');
    cy.get('button').should('have.text', 'count is 0');
    cy.get('button').click();
    cy.get('button').should('have.text', 'count is 1');
    cy.get('button').click();
    cy.get('button').should('have.text', 'count is 2');
    cy.get('button').click();
    cy.get('button').should('have.text', 'count is 3');
    /* ==== End Cypress Studio ==== */
});

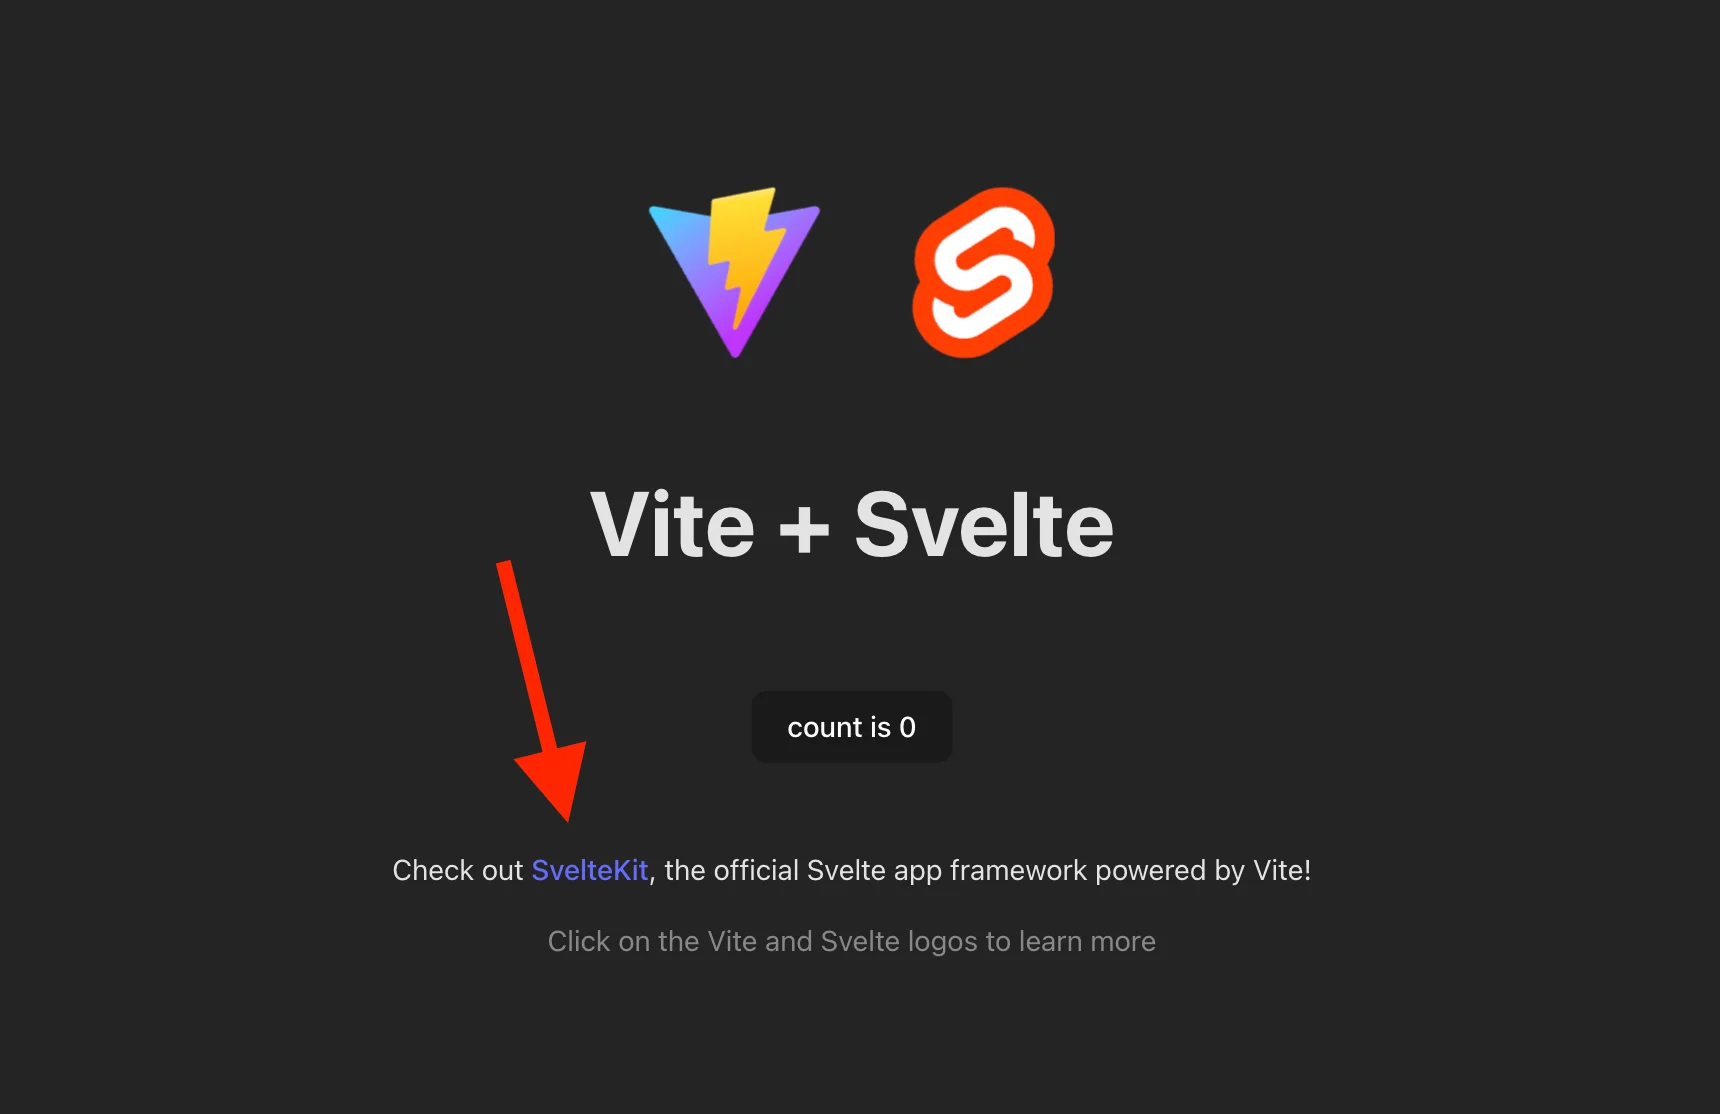
So far, our tests have been very accurate and didn't need any modifications. However, take Studio as a helper to write tests visually and their selector as suggestions. Let's take the bottom link with the text "SvelteKit" as an example.

skitlink

It will generate the assertion:

cy.get(':nth-child(4) > .s-XsEmFtvddWTw').should('have.text', 'SvelteKit');

This selector is accurate, but modifying the elements' structure or order would break the tests.

We don’t want tests to break for reasons that do not affect our users. A change in order does not have the same impact for the user as changing the text of a button or changing the url of a link. These selectors should be as specific as possible, but rely as less as possible on implementation details. Selecting images by its alt attribute it’s a way to find a specific element and at the same time ensure that element is accessible. (Accessibility has a direct impact on users)

As a counterpart, when clicking any of the logos above, we will get very interesting selectors (and assertions).

cy.get('[href="https://vitejs.dev"] > .logo').should('have.attr', 'alt', 'Vite Logo');
cy.get('[href="https://svelte.dev"] > .logo').should('have.attr', 'alt', 'Svelte Logo');

With these assertions, we check that our images have an alt attribute set and are tied to a specified link.

Conclusion

As with any other automated tool, check the output and solve any issues that you may find. Results depend on the structure of the page and Cypress Studio's ability to choose an adequate selector. Overall, this tool can still help you write complex tests with plenty of interactions, and you can later modify any selectors. Besides the selector, I found it helpful in writing the assertions. If you’re new to Cypress or e2e testing, it can be of great help to go from an idea to a working test. Reviewing these tests can be a great way to learn how these tests are built.

This Dot is a consultancy dedicated to guiding companies through their modernization and digital transformation journeys. Specializing in replatforming, modernizing, and launching new initiatives, we stand out by taking true ownership of your engineering projects.

We love helping teams with projects that have missed their deadlines or helping keep your strategic digital initiatives on course. Check out our case studies and our clients that trust us with their engineering.

You might also like

Enhancing Your Playwright Workflow: A Guide to the VSCode Extension cover image

Enhancing Your Playwright Workflow: A Guide to the VSCode Extension

Introduction In my last post, Quick Guide to Playwright Fixtures: Enhancing Your Tests, I delved into some of the enhancements we've been implementing in our end-to-end (E2E) tests using Playwright. As I refine our testing strategies, I've come across a tool that has quickly become an essential part of my workflow: the Playwright VSCode extension. If you're like me and constantly looking for ways to streamline testing and debugging, you'll appreciate any tool that can make the process more efficient and enjoyable. That's where this extension comes in. It's not just about writing tests - it's about enhancing the entire development experience. In this post, I'll walk you through getting started with the Playwright VSCode extension, sharing some tips and tricks that have made a real difference in my day-to-day work. Installing the Extension & Basic Setup Before diving into the Playwright VSCode extension, it's essential to have Playwright installed on your machine. If you haven't done so already, you can quickly install it by running: ` This command will set up Playwright and ensure all necessary dependencies are installed. Once Playwright is ready, the VSCode extension will be installed next. Open Visual Studio Code, navigate to the Extensions view by clicking on the Extensions icon in the Activity Bar on the side of the window, and search for “Playwright”. The official extension, ID: ms-playwright.playwright / named: “Playwright Test for VSCode” by Microsoft, should appear at the top of the list. Click "Install," and you're all set. With the extension installed, you can start leveraging its powerful features to enhance your Playwright testing workflow within VSCode. Running the Tests and Identifying Outputs To run a test, simply open the test file in VSCode. The Playwright extension will automatically detect test files and display a "Run" icon next to each test and test suite. You can click on this icon to run individual tests or test suites. Alternatively, you can run all the tests in your project using the Playwright Test Explorer, accessible from the sidebar. Once you start running your tests, the extension provides real-time feedback within the editor. You'll see the status of each test - whether it passes, fails, or is skipped - right next to the corresponding test in your code. This immediate feedback loop is incredibly helpful for catching issues as you write your tests. The output of your tests will be displayed in the VSCode terminal. You'll see detailed information about each test run. Debugging Step-by-Step I find debugging particularly useful when a test fails unexpectedly or when I want to verify that certain actions are being performed as intended. Instead of guessing what might be wrong, I can see exactly what's going on in each test step, making debugging a much more straightforward and less frustrating process. To start debugging, you can easily set a breakpoint in your test file by clicking on the left margin next to the line number where you'd like the execution to pause. Once your breakpoints are in place, you can initiate the debug process by selecting the "Debug" option next to the test you'd like to investigate. Once the debugger is running, the extension allows you to step through your code, inspect variables, and evaluate expressions - all within VSCode. This real-time insight into your test execution is a game-changer, enabling you to pinpoint issues more effectively and confidently refine your tests. Using the Pick Locator Tool Another handy feature is the "Pick Locator" tool. If you've ever struggled with selecting the right element in your tests, this tool can be a time saver. It helps you generate reliable locators by letting you interact directly with the webpage elements you want to target. To use the Pick Locator tool, click the "Pick Locator" button in the Playwright Test Explorer. This will open a new window where you can navigate to the site you're testing. As you hover over elements on the page, the tool will suggest locators, allowing you to select the most appropriate one for your test. While the Pick Locator tool is handy, it’s important to ensure that the locators you generate are robust and maintainable. This is especially true when integrating them with the fixtures I discussed in my previous blog post. Combining the proper locators with well-designed fixtures can create more reliable and reusable test setups, ultimately making your E2E tests more efficient. Conclusion The Playwright VSCode extension has quickly become indispensable in my development workflow. It significantly enhanced my experience of writing and running Playwright tests. Whether you’re just starting with Playwright or looking to optimize your existing tests, this extension offers a range of features that can save you time and effort. Combining these tools with thoughtful test design, such as leveraging fixtures, you can create a more efficient and effective testing process. I hope this guide has given you a good overview of what the Playwright VSCode extension can do and how it can benefit your work. If you haven’t tried it yet, I highly recommend giving it a go. And as always, feel free to explore further and experiment with the features that best suit your needs....

A Look at Playwright Parallelism cover image

A Look at Playwright Parallelism

A Look at Playwright Parallelism Playwright is an open-source automation library developed by Microsoft, designed for testing web applications across multiple browsers. It enables developers and testers to write scripts that simulate real user actions when interacting with web pages. Playwright supports major browsers like Chrome, Firefox, and Safari, including their headless modes. Recently, it has gained a lot of popularity for its robustness, ease of use, and cross-browser compatibility. In this blog post, we will take a look at one very useful aspect of Playwright: running tests in parallel. Parallelism in Playwright Parallelism in Playwright refers to running multiple test spec files or even test cases within a spec file simultaneously, greatly improving test execution speed. This is achieved by running the tests in worker processes, where each worker process is an OS process, running independently, orchestrated by the test runner. All workers have identical environments, and each starts its own browser instance. Parallel execution is particularly beneficial in continuous integration and continuous deployment (CI/CD) pipelines, reducing overall build and testing times. Playwright's architecture inherently supports parallelism, and most modern test runners integrating with Playwright can leverage this feature. The parallel execution feature makes Playwright a highly efficient tool for large-scale web application testing. Enabling Parallelism By default, if you scaffold the project using npm init playwright@latest, parallelism is already enabled. Assuming that Playwright's configuration includes three browsers and there is a single spec file with two test cases, the total number of tests that Playwright needs to execute is 3x2 = 6. ` Playwright will decide on how many workers to use based on several factors: - Hardware support: Depending on the number of CPU cores and other system resources, the operating system will decide how many processes Playwright can spin up. - The workers property in the playwright.config.ts file. - The --workers argument to the playwright test command. For example, npx playwright test --workers 4. The --workers argument overrides the workers property in the configuration. However, in both cases, the number of workers can go up to the number of processes that Playwright can spin up, as decided by the operating system. Once it has determined the number of workers, and if the number of workers is larger than 1, Playwright will then decide how to split the work between workers. This decision also depends on several factors, such as the number of browsers involved and the granularity of the parallelism, which can be controlled in several ways: - In the test spec file, you can specify whether to run the test cases in parallel. To run tests in parallel, you can invoke test.describe.configure({ mode: 'parallel' }); before your test cases. - Alternatively, you can configure it per project by setting the fullyParallel: true property. - And finally, you can set it globally in the config, using the same property: fullyParallel: true. Therefore, if there is more than one worker and the parallel mode is enabled, Playwright will assign test cases to each worker as they become available. This scenario is ideal because it means that each test is stateless, and the resources are used most efficiently. ` Disabling Parallelism What if, however, the tests are not stateless? Imagine one test changes the global configuration of the app via some sort of administration page, and the configuration affects different parts of the app, like enabling or disabling features. Other tests, which may be testing those features, would be impacted and would report incorrect results. In such cases, you might want to disable parallelism. You can disable any parallelism globally by allowing just a single worker at any time. Following the instructions from the previous sections to configure the number of workers, you can either set the workers: 1 option in the configuration file or pass --workers=1 to the command line. ` Let's have a look at our test output in this case: ` Now, compare the time it took with one worker versus the time it took with four workers. It took 8.2 seconds with one worker compared to only 3.9 seconds with multiple workers. That might be an inefficient usage of resources, of course, especially if you have a large test suite and some of the tests are stateless and can be run without impacting other tests. Tweaking Parallelism If you want some tests not to run in parallel, but still want to utilize your workers, you can do that. Again, following the configuration options from the previous sections, you can annotate the entire spec file with test.describe.configure({ mode: 'serial' }); to have the tests run sequentially in that spec file, or use the fullyParallel: false property to run tests sequentially on the project level, or using the same property to run tests sequentially on the global level. This means you can still split the tests between workers, but the tests would be run sequentially within a worker depending on the configuration. For example, let's set the number of workers to 4, but set fullyParallel: false globally. ` The tests need to be run sequentially, but since each browser instance effectively provides an isolated environment, this means tests cannot impact each other between environments, and they are safe to be executed sequentially within an environment. This means setting fullyParallel: false on the global level is not the same as having workers: 1, since the browsers themselves offer an isolated environment for the tests to run sequentially. However, since we only have 3 environments (3 browsers), we cannot fully utilize 4 workers as we wanted, so the number of workers is 3. Conclusion In conclusion, Playwright's workers are the core of its parallelism capabilities, enabling tests to run concurrently across different environments and browsers with efficiency. Through its many configuration properties, Playwright allows you to configure parallelism at multiple levels, offering a granular approach to optimizing your test runs. Beyond just executing tests in parallel on a single machine, Playwright's parallelism can even extend to splitting work across multiple machines through sharding, significantly enhancing the scalability of your testing. We hope this blog post was useful. For those interested in delving deeper into the world of Playwright and its powerful features, we've also recently released a JS Drop titled Awesome Web Testing with Playwright, and we also hosted Debbie O'Brien from Microsoft in a Modern Web episode....

Svelte 5 is Here! cover image

Svelte 5 is Here!

Svelte 5 was finally released after a long time in development. Fortunately, we've been able to test it for some time, and now it has a stable release. Let's dig into its features and why this is such a significant change, even though Svelte 4 code is almost 100% compatible. Svelte syntax everywhere This is one of my favorite additions. Previously, Svelte syntax was limited to a component element. Refactoring code from a component and moving it to a JavaScript file worked differently. Now you can use the .svelte.js or .svelte.ts extension, which allows you to use the same syntax everywhere. It's important to note that it's a way to express that this is not just JS, and what you write may be compiled to something else, just like .svelte files are not just html even though they look very similar. Runes The introduction of runes is one of the most significant changes in Svelte. Many users felt attracted to variables being instantly reactive in previous versions. ` There was, however, a lot of magic underneath and a considerable amount of work from the compiler to make it behave reactively. $state In Svelte 5, a reactive variable has to be explicitly declared using the $state rune, which brings a clear distinction between what is reactive and what isn’t. ` In the previous code, $state is not an actual function being called; it's a hint for the compiler to do something special with this declaration. Rune names always start with a dollar sign ($) and do not need to be imported. However, there’s much more to the changes than just the way we declare reactive variables. Runes bring a lot of new features that make Svelte 5 a great improvement. In Svelte 5, objects or arrays use Proxies to allow for granular reactivity, meaning that individual properties in an object are reactive, even if they are nested objects or arrays. If you modify a property, it will only update that property and will not trigger an update on the whole object. It also supports triggering updates when methods like array.push are called. In previous versions, an assignment was required to trigger an update: ` To have a similar behavior of svelte 4 (no deep reactivity), use the $state.raw() rune. This syntax of .* is common for related features of a rune: $state.raw() will require an assignment to trigger reactivity. ` Because proxies are used, you may need to extract the underlying state instead of the proxy itself. In that case, $state.snapshot() should be used: ` $derived We will use $derived and $derived.by to declare a derived state. The two runes are essentially the same, except one allows us to use a function instead of an expression, allowing for more complex operations to calculate the derived values. ` $effect Effects are useful for running something triggered by a change in state. One of the things you'll note from the $effect rune is that dependencies don't need to be explicit. Those will be picked from reactive values read synchronously in the body of the effect function. ` Something to bear in mind is that these dependencies are picked each time the effect runs. The values read during the last run become the dependencies of the effect. ` Depending on the result of the random method, foo or bar will stop being a dependency of the effect. You should place them outside the condition so they can trigger reruns of the effect. *Variants* of the effect rune are $effect.pre, which runs before a DOM update, and $effect.tracking(), which checks for the context of the effect (true for an effect inside an effect or in the template). $props This rune replaces the export let keywords used in previous versions to define a component's props. To use the $props syntax, we can consider it to return an object with all the properties a component receives. We can use JavaScript syntax to destructure it or use the rest property if we want to retrieve every property not explicitly destructured.. ` $bindable If you want to mutate a prop so that the change flows back to the parent, you can use the $bindable prop to make it work in both directions. A parent component can pass a value to a child component, and the child component is able to modify it, returning the data back to the parent component. ` $inspect The $inspect rune only works in dev mode and will track dependencies deeply. By default, it will call console.log with the provided argument whenever it detects a change. To change the underlying function, use $inspect.with().with): ` $host The host rune gives access to the host element when compiling as a custom element: ` ` Other changes Another important change is that component events are just props in Svelte 5, so you can destructure them using the $props() rune: ` A special children property can be used to project content into a component instead of using slots. Inside the components, use the [@render[(https://svelte.dev/docs/svelte/@render) tag to place them. ` Optional chaining (?.) prevents from attempting to render it if no children are passed in. If you need to render different components in different places (named slots before Svelte 5, you can pass them as any other prop, and use @render with them. Snippets Snippets allow us to declare markup slices and render them conveniently using the render tag (@render). They can take any number of arguments. ` Snippets can also be passed as props to other components. ` ` Conclusion Some exciting changes to the Svelte syntax were introduced while, at the same time, maximum compatibility efforts were made. This was a massive rewrite with numerous improvements in terms of performance, bundle size, and DX. Besides that, a new CLI has been released, making the whole experience of starting a project or adding features delightful. If you haven't tried Svelte before, it's a great time to try it now....

The Importance of a Scientific Mindset in Software Engineering: Part 2 (Debugging) cover image

The Importance of a Scientific Mindset in Software Engineering: Part 2 (Debugging)

The Importance of a Scientific Mindset in Software Engineering: Part 2 (Debugging) In the first part of my series on the importance of a scientific mindset in software engineering, we explored how the principles of the scientific method can help us evaluate sources and make informed decisions. Now, we will focus on how these principles can help us tackle one of the most crucial and challenging tasks in software engineering: debugging. In software engineering, debugging is often viewed as an art - an intuitive skill honed through experience and trial and error. In a way, it is - the same as a GP, even a very evidence-based one, will likely diagnose most of their patients based on their experience and intuition and not research scientific literature every time; a software engineer will often rely on their experience and intuition to identify and fix common bugs. However, an internist faced with a complex case will likely not be able to rely on their intuition alone and must apply the scientific method to diagnose the patient. Similarly, a software engineer can benefit from using the scientific method to identify and fix the problem when faced with a complex bug. From that perspective, treating engineering challenges like scientific inquiries can transform the way we tackle problems. Rather than resorting to guesswork or gut feelings, we can apply the principles of the scientific method—forming hypotheses, designing controlled experiments, gathering and evaluating evidence—to identify and eliminate bugs systematically. This approach, sometimes referred to as "scientific debugging," reframes debugging from a haphazard process into a structured, disciplined practice. It encourages us to be skeptical, methodical, and transparent in our reasoning. For instance, as Andreas Zeller notes in the book _Why Programs Fail_, the key aspect of scientific debugging is its explicitness: Using the scientific method, you make your assumptions and reasoning explicit, allowing you to understand your assumptions and often reveals hidden clues that can lead to the root cause of the problem on hand. Note: If you'd like to read an excerpt from the book, you can find it on Embedded.com. Scientific Debugging At its core, scientific debugging applies the principles of the scientific method to the process of finding and fixing software defects. Rather than attempting random fixes or relying on intuition, it encourages engineers to move systematically, guided by data, hypotheses, and controlled experimentation. By adopting debugging as a rigorous inquiry, we can reduce guesswork, speed up the resolution process, and ensure that our fixes are based on solid evidence. Just as a scientist begins with a well-defined research question, a software engineer starts by identifying the specific symptom or error condition. For instance, if our users report inconsistencies in the data they see across different parts of the application, our research question could be: _"Under what conditions does the application display outdated or incorrect user data?"_ From there, we can follow a structured debugging process that mirrors the scientific method: - 1. Observe and Define the Problem: First, we need to clearly state the bug's symptoms and the environment in which it occurs. We should isolate whether the issue is deterministic or intermittent and identify any known triggers if possible. Such a structured definition serves as the groundwork for further investigation. - 2. Formulate a Hypothesis: A hypothesis in debugging is a testable explanation for the observed behavior. For instance, you might hypothesize: _"The data inconsistency occurs because a caching layer is serving stale data when certain user profiles are updated."_ The key is that this explanation must be falsifiable; if experiments don't support the hypothesis, it must be refined or discarded. - 3. Collect Evidence and Data: Evidence often includes logs, system metrics, error messages, and runtime traces. Similar to reviewing primary sources in academic research, treat your raw debugging data as crucial evidence. Evaluating these data points can reveal patterns. In our example, such patterns could be whether the bug correlates with specific caching mechanisms, increased memory usage, or database query latency. During this step, it's essential to approach data critically, just as you would analyze the quality and credibility of sources in a research literature review. Don't forget that even logs can be misleading, incomplete, or even incorrect, so cross-referencing multiple sources is key. - 4. Design and Run Experiments: Design minimal, controlled tests to confirm or refute your hypothesis. In our example, you may try disabling or shortening the cache's time-to-live (TTL) to see if more recent data is displayed correctly. By manipulating one variable at a time - such as cache invalidation intervals - you gain clearer insights into causation. Tools such as profilers, debuggers, or specialized test harnesses can help isolate factors and gather precise measurements. - 5. Analyze Results and Refine Hypotheses: If the experiment's outcome doesn't align with your hypothesis, treat it as a stepping stone, not a dead end. Adjust your explanation, form a new hypothesis, or consider additional variables (for example, whether certain API calls bypass caching). Each iteration should bring you closer to a better understanding of the bug's root cause. Remember, the goal is not to prove an initial guess right but to arrive at a verifiable explanation. - 6. Implement and Verify the Fix: Once you're confident in the identified cause, you can implement the fix. Verification doesn't stop at deployment - re-test under the same conditions and, if possible, beyond them. By confirming the fix in a controlled manner, you ensure that the solution is backed by evidence rather than wishful thinking. - Personally, I consider implementing end-to-end tests (e.g., with Playwright) that reproduce the bug and verify the fix to be a crucial part of this step. This both ensures that the bug doesn't reappear in the future due to changes in the codebase and avoids possible imprecisions of manual testing. Now, we can explore these steps in more detail, highlighting how the scientific method can guide us through the debugging process. Establishing Clear Debugging Questions (Formulating a Hypothesis) A hypothesis is a proposed explanation for a phenomenon that can be tested through experimentation. In a debugging context, that phenomenon is the bug or issue you're trying to resolve. Having a clear, falsifiable statement that you can prove or disprove ensures that you stay focused on the real problem rather than jumping haphazardly between possible causes. A properly formulated hypothesis lets you design precise experiments to evaluate whether your explanation holds true. To formulate a hypothesis effectively, you can follow these steps: 1. Clearly Identify the Symptom(s) Before forming any hypothesis, pin down the specific issue users are experiencing. For instance: - "Users intermittently see outdated profile information after updating their accounts." - "Some newly created user profiles don't reflect changes in certain parts of the application." Having a well-defined problem statement keeps your hypothesis focused on the actual issue. Just like a research question in science, the clarity of your symptom definition directly influences the quality of your hypothesis. 2. Draft a Tentative Explanation Next, convert your symptom into a statement that describes a _possible root cause_, such as: - "Data inconsistency occurs because the caching layer isn't invalidating or refreshing user data properly when profiles are updated." - "Stale data is displayed because the cache timeout is too long under certain load conditions." This step makes your assumption about the root cause explicit. As with the scientific method, your hypothesis should be something you can test and either confirm or refute with data or experimentation. 3. Ensure Falsifiability A valid hypothesis must be falsifiable - meaning it can be proven _wrong_. You'll struggle to design meaningful experiments if a hypothesis is too vague or broad. For example: - Not Falsifiable: "Occasionally, the application just shows weird data." - Falsifiable: "Users see stale data when the cache is not invalidated within 30 seconds of profile updates." Making your hypothesis specific enough to fail a test will pave the way for more precise debugging. 4. Align with Available Evidence Match your hypothesis to what you already know - logs, stack traces, metrics, and user reports. For example: - If logs reveal that cache invalidation events aren't firing, form a hypothesis explaining why those events fail or never occur. - If metrics show that data served from the cache is older than the configured TTL, hypothesize about how or why the TTL is being ignored. If your current explanation contradicts existing data, refine your hypothesis until it fits. 5. Plan for Controlled Tests Once you have a testable hypothesis, figure out how you'll attempt to _disprove_ it. This might involve: - Reproducing the environment: Set up a staging/local system that closely mimics production. For instance with the same cache layer configurations. - Varying one condition at a time: For example, only adjust cache invalidation policies or TTLs and then observe how data freshness changes. - Monitoring metrics: In our example, such monitoring would involve tracking user profile updates, cache hits/misses, and response times. These metrics should lead to confirming or rejecting your explanation. These plans become your blueprint for experiments in further debugging stages. Collecting and Evaluating Evidence After formulating a clear, testable hypothesis, the next crucial step is to gather data that can either support or refute it. This mirrors how scientists collect observations in a literature review or initial experiments. 1. Identify "Primary Sources" (Logs, Stack Traces, Code History): - Logs and Stack Traces: These are your direct pieces of evidence - treat them like raw experimental data. For instance, look closely at timestamps, caching-related events (e.g., invalidation triggers), and any error messages related to stale reads. - Code History: Look for related changes in your source control, e.g. using Git bisect. In our example, we would look for changes to caching mechanisms or references to cache libraries in commits, which could pinpoint when the inconsistency was introduced. Sometimes, reverting a commit that altered cache settings helps confirm whether the bug originated there. 2. Corroborate with "Secondary Sources" (Documentation, Q&A Forums): - Documentation: Check official docs for known behavior or configuration details that might differ from your assumptions. - Community Knowledge: Similar issues reported on GitHub or StackOverflow may reveal known pitfalls in a library you're using. 3. Assess Data Quality and Relevance: - Look for Patterns: For instance, does stale data appear only after certain update frequencies or at specific times of day? - Check Environmental Factors: For instance, does the bug happen only with particular deployment setups, container configurations, or memory constraints? - Watch Out for Biases: Avoid seeking only the data that confirms your hypothesis. Look for contradictory logs or metrics that might point to other root causes. You keep your hypothesis grounded in real-world system behavior by treating logs, stack traces, and code history as primary data - akin to raw experimental results. This evidence-first approach reduces guesswork and guides more precise experiments. Designing and Running Experiments With a hypothesis in hand and evidence gathered, it's time to test it through controlled experiments - much like scientists isolate variables to verify or debunk an explanation. 1. Set Up a Reproducible Environment: - Testing Environments: Replicate production conditions as closely as possible. In our example, that would involve ensuring the same caching configuration, library versions, and relevant data sets are in place. - Version Control Branches: Use a dedicated branch to experiment with different settings or configuration, e.g., cache invalidation strategies. This streamlines reverting changes if needed. 2. Control Variables One at a Time: - For instance, if you suspect data inconsistency is tied to cache invalidation events, first adjust only the invalidation timeout and re-test. - Or, if concurrency could be a factor (e.g., multiple requests updating user data simultaneously), test different concurrency levels to see if stale data issues become more pronounced. 3. Measure and Record Outcomes: - Automated Tests: Tests provide a great way to formalize and verify your assumptions. For instance, you could develop tests that intentionally update user profiles and check if the displayed data matches the latest state. - Monitoring Tools: Monitor relevant metrics before, during, and after each experiment. In our example, we might want to track cache hit rates, TTL durations, and query times. - Repeat Trials: Consistency across multiple runs boosts confidence in your findings. 4. Validate Against a Baseline: - If baseline tests manifest normal behavior, but your experimental changes manifest the bug, you've isolated the variable causing the issue. E.g. if the baseline tests show that data is consistently fresh under normal caching conditions but your experimental changes cause stale data. - Conversely, if your change eliminates the buggy behavior, it supports your hypothesis - e.g. that the cache configuration was the root cause. Each experiment outcome is a data point supporting or contradicting your hypothesis. Over time, these data points guide you toward the true cause. Analyzing Results and Iterating In scientific debugging, an unexpected result isn't a failure - it's valuable feedback that brings you closer to the right explanation. 1. Compare Outcomes to the hypothesis. For instance: - Did user data stay consistent after you reduced the cache TTL or fixed invalidation logic? - Did logs show caching events firing as expected, or did they reveal unexpected errors? - Are there only partial improvements that suggest multiple overlapping issues? 2. Incorporate Unexpected Observations: - Sometimes, debugging uncovers side effects - e.g. performance bottlenecks exposed by more frequent cache invalidations. Note these for future work. - If your hypothesis is disproven, revise it. For example, the cache may only be part of the problem, and a separate load balancer setting also needs attention. 3. Avoid Confirmation Bias: - Don't dismiss contrary data. For instance, if you see evidence that updates are fresh in some modules but stale in others, you may have found a more nuanced root cause (e.g., partial cache invalidation). - Consider other credible explanations if your teammates propose them. Test those with the same rigor. 4. Decide If You Need More Data: - If results aren't conclusive, add deeper instrumentation or enable debug modes to capture more detailed logs. - For production-only issues, implement distributed tracing or sampling logs to diagnose real-world usage patterns. 5. Document Each Iteration: - Record the results of each experiment, including any unexpected findings or new hypotheses that arise. - Through iterative experimentation and analysis, each cycle refines your understanding. By letting evidence shape your hypothesis, you ensure that your final conclusion aligns with reality. Implementing and Verifying the Fix Once you've identified the likely culprit - say, a misconfigured or missing cache invalidation policy - the next step is to implement a fix and verify its resilience. 1. Implementing the Change: - Scoped Changes: Adjust just the component pinpointed in your experiments. Avoid large-scale refactoring that might introduce other issues. - Code Reviews: Peer reviews can catch overlooked logic gaps or confirm that your changes align with best practices. 2. Regression Testing: - Re-run the same experiments that initially exposed the issue. In our stale data example, confirm that the data remains fresh under various conditions. - Conduct broader tests - like integration or end-to-end tests - to ensure no new bugs are introduced. 3. Monitoring in Production: - Even with positive test results, real-world scenarios can differ. Monitor logs and metrics (e.g. cache hit rates, user error reports) closely post-deployment. - If the buggy behavior reappears, revisit your hypothesis or consider additional factors, such as unpredicted user behavior. 4. Benchmarking and Performance Checks (If Relevant): - When making changes that affect the frequency of certain processes - such as how often a cache is refreshed - be sure to measure the performance impact. Verify you meet any latency or resource usage requirements. - Keep an eye on the trade-offs: For instance, more frequent cache invalidations might solve stale data but could also raise system load. By systematically verifying your fix - similar to confirming experimental results in research - you ensure that you've addressed the true cause and maintained overall software stability. Documenting the Debugging Process Good science relies on transparency, and so does effective debugging. Thorough documentation guarantees your findings are reproducible and valuable to future team members. 1. Record Your Hypothesis and Experiments: - Keep a concise log of your main hypothesis, the tests you performed, and the outcomes. - A simple markdown file within the repo can capture critical insights without being cumbersome. 2. Highlight Key Evidence and Observations: - Note the logs or metrics that were most instrumental - e.g., seeing repeated stale cache hits 10 minutes after updates. - Document any edge cases discovered along the way. 3. List Follow-Up Actions or Potential Risks: - If you discover additional issues - like memory spikes from more frequent invalidation - note them for future sprints. - Identify parts of the code that might need deeper testing or refactoring to prevent similar issues. 4. Share with Your Team: - Publish your debugging report on an internal wiki or ticket system. A well-documented troubleshooting narrative helps educate other developers. - Encouraging open discussion of the debugging process fosters a culture of continuous learning and collaboration. By paralleling scientific publication practices in your documentation, you establish a knowledge base to guide future debugging efforts and accelerate collective problem-solving. Conclusion Debugging can be as much a rigorous, methodical exercise as an art shaped by intuition and experience. By adopting the principles of scientific inquiry - forming hypotheses, designing controlled experiments, gathering evidence, and transparently documenting your process - you make your debugging approach both systematic and repeatable. The explicitness and structure of scientific debugging offer several benefits: - Better Root-Cause Discovery: Structured, hypothesis-driven debugging sheds light on the _true_ underlying factors causing defects rather than simply masking symptoms. - Informed Decisions: Data and evidence lead the way, minimizing guesswork and reducing the chance of reintroducing similar issues. - Knowledge Sharing: As in scientific research, detailed documentation of methods and outcomes helps others learn from your process and fosters a collaborative culture. Ultimately, whether you are diagnosing an intermittent crash or chasing elusive performance bottlenecks, scientific debugging brings clarity and objectivity to your workflow. By aligning your debugging practices with the scientific method, you build confidence in your solutions and empower your team to tackle complex software challenges with precision and reliability. But most importantly, do not get discouraged by the number of rigorous steps outlined above or by the fact you won't always manage to follow them all religiously. Debugging is a complex and often frustrating process, and it's okay to rely on your intuition and experience when needed. Feel free to adapt the debugging process to your needs and constraints, and as long as you keep the scientific mindset at heart, you'll be on the right track....

Let's innovate together!

We're ready to be your trusted technical partners in your digital innovation journey.

Whether it's modernization or custom software solutions, our team of experts can guide you through best practices and how to build scalable, performant software that lasts.

Prefer email? hi@thisdot.co