Skip to content

Intro to Svelte

This article was written over 18 months ago and may contain information that is out of date. Some content may be relevant but please refer to the relevant official documentation or available resources for the latest information.

Intro to Svelte

Svelte is a JavaScript tool that may look similar to other frameworks, or have similar concepts, but it works differently, making it stand out from the rest. Svelte is reactive by nature, and instead of using a virtual dom, it will directly update the DOM in an efficient way.

It is possible to achieve this by delegating its work to a compile step, which will make the framework itself "disappear", and will ship some optimized vanilla JavaScript code.

Let's take a look at an example of a Svelte component.

<!-- App.svelte -->
<h1>This is Svelte</h1>
<p class="omg">It looks like regular html</p>

As you can see, at a first glance, it is no different than plain old HTML (for a non-dynamic component). You can keep using the class keyword.

Let's add some CSS to our component.

<!-- App.svelte -->
<h1>This is Svelte</h1>
<p class="omg">It looks like regular html</p>
<p class="styled">CSS rocks!</p>

<style>
  h1 {
    font-size: 30px;
  }
  .styled {
    color: red;
  }
</style>

Once again, this looks like regular CSS, and that's because it is regular CSS.

How about adding some JS to it?

<!-- App.svelte -->
<script>
  function logSomething(something) {
    console.log(something);
  }

  logSomething('it works');
</script>

<h1>This is Svelte</h1>
<p class="omg">It looks like regular html</p>
<p class="styled">CSS rocks!</p>

<style>
  h1 {
    font-size: 30px;
  }
  .styled {
    color: red;
  }
</style>
Screen Shot 2021-04-20 at 07.58.25

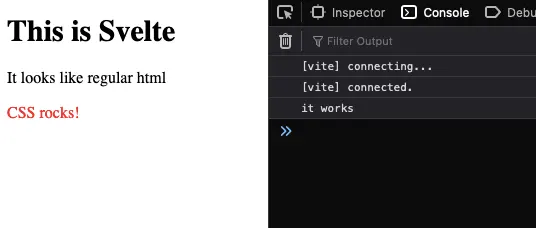
So, we have HTML that looks like HTML, CSS that looks like CSS, and JavaScript that looks like JavaScript, all packed in a single svelte file.

Of course, this is not everything Svelte has to offer.

How to start a new Svelte project

To start a svelte project, you can use the command npx degit [sveltejs/template](https://github.com/sveltejs/template) my-svelte-project as suggested on their website, but my preferred way of doing it these days is to use vite.

Both methods can be set up to use TypeScript.

Let's create a new project.

npm init @vitejs/app

✔ Project name: · my-svelte-project
✔ Select a framework: · svelte
✔ Select a variant: · TypeScript

cd my-svelte-project
pnpm install //use the package manager you prefer
pnpm run dev

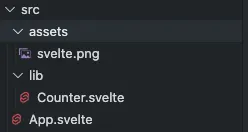
Now that our project is created, it will have a folder structure that looks like this.

folder structure

How do you do x in Svelte?

Let's create a new component to be able to test different features of Svelte. I will remove the default component created (Counter.svelte)

rm -rf src/lib/Counter.svelte     // removes the component created by default
touch src/lib/Example.svelte      // creates a new svelte component

We need to update App.svelte to import our new component and render it

<!-- App.svelte -->
<script>
  import Example from './lib/Example.svelte';
</script>

<Example />

Using variables in the template

To use a variable in the template we need to: Declare a variable in our <script> Use the variable within brackets {} in the template

In our component:

<!-- src/lib/Example.svelte -->
<script lang="ts">
  let greeting: string = 'Hi';
</script>

<p>{greeting}</p>

If you run the application with the command npm run dev, the project will start, and run by default on port 3000. Changes will be reflected in the browser.

props/inputs

To create an input we need to export a variable.

<!-- src/lib/Example.svelte -->
<script lang="ts">
  export let name: string;
  let greeting: string = 'Hi';
</script>

<span>{greeting}, {name}</span>

We will need to update our App to pass the value of name.

<!-- App.svelte -->
<script>
  import Example from './lib/Example.svelte';
</script>

<Example name="John" />

Event

You can listen to events with the on directive.

Let's add an event to our span element in the Example component.

<script lang="ts">
  export let name: string;
  let greeting: string = 'Hi';

  function toggleGreeting() {
    if (greeting === 'Hi') {
      greeting = 'Bye';
    } else {
      greeting = 'Hi';
    }
  }
</script>

<p>{greeting}, {name}</p>
<button on:click={toggleGreeting}>Toggle greeting</button>

You can now see the text changing when clicking on the button.

Sometimes you will need to pass a custom event from a child component to a parent component. To trigger a custom event we need to import and use the createEventDispatcher method.

<script lang="ts">
  import { createEventDispatcher } from 'svelte';

  const dispatch = createEventDispatcher();

  export let name: string;
  let greeting: string = 'Hi';

  function toggleGreeting() {
    if (greeting === 'Hi') {
      greeting = 'Bye';
    } else {
      greeting = 'Hi';
    }
  }

  function toggleName() {
    dispatch('myCustomEvent');
  }
</script>

<p>{greeting}, {name}</p>
<button on:click={toggleGreeting}>Toggle greeting</button>
<button on:click={toggleName}>Toggle Name</button>

We need to update our App component too, to do something with the event.

<script>
  import Example from './lib/Example.svelte';

  let name = 'John';
  function onMyCustomEvent() {
    if (name === 'John') {
      name = 'Jane';
    } else {
      name = 'John';
    }
  }
</script>

<Example {name} on:myCustomEvent={onMyCustomEvent} />

This event can pass data using the second argument in the dispatch method.

<!-- src/lib/Example.svelte -->

<script lang="ts">
  import { createEventDispatcher } from 'svelte';

  const dispatch = createEventDispatcher();

  export let name: string;
  let greeting: string = 'Hi';

  function toggleGreeting() {
    if (greeting === 'Hi') {
      greeting = 'Bye';
    } else {
      greeting = 'Hi';
    }

    let nextName;
    if (name === 'John') {
      nextName = 'Jane';
    } else {
      nextName = 'John';
    }
  }

  function toggleName() {
  	let nextName;
    if (name === 'John') {
      nextName = 'Jane';
    } else {
      nextName = 'John';
    }
    dispatch('myCustomEvent', nextName);
  }

</script>

<p>{greeting}, {name}</p>
<button on:click={toggleGreeting}>Toggle greeting</button>
<button on:click={toggleName}>Toggle Name</button>
<script>
  import Example from './lib/Example.svelte';

  let name = 'John';
  function onMyCustomEvent(event) {
    name = event.detail;
  }
</script>

<Example {name} on:myCustomEvent={onMyCustomEvent} />

Now the Example component is emitting an event with the new name. And the App component is handling it.

Reactivity

One of the main features of svelte is that it makes reactivity so easy to reason about.

To include a reactive statement, you need to prepend it with $:. The compiler will figure out when it should update the reactive values based on the variables that it depends on. In our previous example:

<!-- src/lib/Example.svelte -->

<script lang="ts">
  import { createEventDispatcher } from 'svelte';

  const dispatch = createEventDispatcher();

  export let name: string;
  let greeting: string = 'Hi';

  $: reactiveValue = `You're saying ${greeting} to ${name}`

  function toggleGreeting() {
    if (greeting === 'Hi') {
      greeting = 'Bye';
    } else {
      greeting = 'Hi';
    }

    let nextName;
    if (name === 'John') {
      nextName = 'Jane';
    } else {
      nextName = 'John';
    }
  }

  function toggleName() {
  	let nextName;
    if (name === 'John') {
      nextName = 'Jane';
    } else {
      nextName = 'John';
    }
    dispatch('myCustomEvent', nextName);
  }

</script>

<p>{greeting}, {name}</p>
<p>{reactiveValue}</p>
<button on:click={toggleGreeting}>Toggle greeting</button>
<button on:click={toggleName}>Toggle Name</button>

In this example, reactiveVlaue is dependant on name and greeting. Whenever any of these values changes, reactiveValue will be updated.

Reactivity in Svelte will be triggered by assignments, which means that it's required to assign a value to make it work. Array.prototype.push is not an assignment, so it will not work.

Flow control

if/else You can change your template rendering based on some condition use if else. The syntax looks like this

{#if <condition>}
	some code
{:else if}
	more code
{:else}
	more code
{/if}

The syntax is similar to other template modifiers. start with {# }, continue with {: } and end with {/ }.

each You can iterate over an array with an each block.

{#each anArray as item, i}
<span>{item.name}{/span}
{/each}

When iterating this way and modifying the array, items will be added or removed at the end of the block, and the values of the items will be updated accordingly.

If you need to keep track of each element, you can use a key. This is common for other frameworks too.

The syntax for this is:

{#each anArray as item (item.id)}
<span>{item.name}{/span}
{/each}

where the id is the unique key in this example.

Asynchronous rendering

Sometimes, you need to wait before rendering something (or not). We can make use of an async block in this case. Similar to the other template modifiers, the syntax is like this.

{#await aPromise}
	<p>Somthing to render while promise has not resolved
{:then value}
	<p>If the promise is successful you can render the value: {value}</p>
{:catch error}
	<p>There was an error: {error.message}</p>
{/await}

Stores

Another nice feature of svelte is stores, which provides a way of having global pieces of state in your application. They can be accessed anywhere in your application, and are reactive.

A readable store cannot be modified from the outside (like a component). A writable store can be accessed and updated from a component. The third kind of store is a derived store, which will depend on other stores, and update accordingly.

Let's share some state between components using a store:

// lib/stores.ts
import { writable } from 'svelte/store';

export const age = writable(32);
<!-- src/lib/Example.svelte -->

<script lang="ts">
  import { createEventDispatcher } from 'svelte';```
  import { age } from './stores.js';

  const dispatch = createEventDispatcher();

  export let name: string;
  let greeting: string = 'Hi';

  $: reactiveValue = `You're saying ${greeting} to ${name}`

  function toggleGreeting() {
    if (greeting === 'Hi') {
      greeting = 'Bye';
    } else {
      greeting = 'Hi';
    }
  }

  function toggleName() {
  	let nextName;
    if (name === 'John') {
      nextName = 'Jane';
    } else {
      nextName = 'John';
    }
    dispatch('myCustomEvent', nextName);
  }

   function toggleAge() {
   	age.update(value => value === 32 ? 35 : 32);
  }

</script>

<p>{greeting}, {name}</p>
<p>{reactiveValue}</p>
<button on:click={toggleGreeting}>Toggle greeting</button>
<button on:click={toggleName}>Toggle Name</button>
<button on:click={toggleAge}>Toggle Age</button>
<!-- src/lib/Age.svelte -->

<script lang="ts">
  import { age } from './stores';
</script>

<span>Your age is: {$age}</span>
<script>
  import Example from './lib/Example.svelte';
  import Age from './lib/Age.svelte';

  let name = 'John';
  function onMyCustomEvent(event) {
    name = event.detail;
  }
</script>

<Example {name} on:myCustomEvent={onMyCustomEvent} />
<Age />

Svelte is a fully-featured framework that shifts some of the load to the compiler process. There's more to it like animations and context. So make sure to keep an eye on it, and give it a try whenever you can.

Sapper

Sapper is a framework built on top of Svelte, which adds more to it like router navigations, SSG, and SSR. It never reached v1.0, but it led the way for the future of Svelte.

Svelte-Kit and the future

Announced last year, Svelte-Kit takes what's learned in Svelte and Sapper, and combines them into one single tool/framework, so you don't have to decide to either use Sapper or regular Svelte. It preserves the main features of Sapper, like file-based routing, SSR, and SSG. It's still in Beta, but you can try it today. (I already migrated a Sapper site). Svelte-Kit uses Vite by default.

If you want to give it a try, you can start a new project by running npm init svelte@next my-app.

This Dot is a consultancy dedicated to guiding companies through their modernization and digital transformation journeys. Specializing in replatforming, modernizing, and launching new initiatives, we stand out by taking true ownership of your engineering projects.

We love helping teams with projects that have missed their deadlines or helping keep your strategic digital initiatives on course. Check out our case studies and our clients that trust us with their engineering.

You might also like

The Importance of a Scientific Mindset in Software Engineering: Part 2 (Debugging) cover image

The Importance of a Scientific Mindset in Software Engineering: Part 2 (Debugging)

The Importance of a Scientific Mindset in Software Engineering: Part 2 (Debugging) In the first part of my series on the importance of a scientific mindset in software engineering, we explored how the principles of the scientific method can help us evaluate sources and make informed decisions. Now, we will focus on how these principles can help us tackle one of the most crucial and challenging tasks in software engineering: debugging. In software engineering, debugging is often viewed as an art - an intuitive skill honed through experience and trial and error. In a way, it is - the same as a GP, even a very evidence-based one, will likely diagnose most of their patients based on their experience and intuition and not research scientific literature every time; a software engineer will often rely on their experience and intuition to identify and fix common bugs. However, an internist faced with a complex case will likely not be able to rely on their intuition alone and must apply the scientific method to diagnose the patient. Similarly, a software engineer can benefit from using the scientific method to identify and fix the problem when faced with a complex bug. From that perspective, treating engineering challenges like scientific inquiries can transform the way we tackle problems. Rather than resorting to guesswork or gut feelings, we can apply the principles of the scientific method—forming hypotheses, designing controlled experiments, gathering and evaluating evidence—to identify and eliminate bugs systematically. This approach, sometimes referred to as "scientific debugging," reframes debugging from a haphazard process into a structured, disciplined practice. It encourages us to be skeptical, methodical, and transparent in our reasoning. For instance, as Andreas Zeller notes in the book _Why Programs Fail_, the key aspect of scientific debugging is its explicitness: Using the scientific method, you make your assumptions and reasoning explicit, allowing you to understand your assumptions and often reveals hidden clues that can lead to the root cause of the problem on hand. Note: If you'd like to read an excerpt from the book, you can find it on Embedded.com. Scientific Debugging At its core, scientific debugging applies the principles of the scientific method to the process of finding and fixing software defects. Rather than attempting random fixes or relying on intuition, it encourages engineers to move systematically, guided by data, hypotheses, and controlled experimentation. By adopting debugging as a rigorous inquiry, we can reduce guesswork, speed up the resolution process, and ensure that our fixes are based on solid evidence. Just as a scientist begins with a well-defined research question, a software engineer starts by identifying the specific symptom or error condition. For instance, if our users report inconsistencies in the data they see across different parts of the application, our research question could be: _"Under what conditions does the application display outdated or incorrect user data?"_ From there, we can follow a structured debugging process that mirrors the scientific method: - 1. Observe and Define the Problem: First, we need to clearly state the bug's symptoms and the environment in which it occurs. We should isolate whether the issue is deterministic or intermittent and identify any known triggers if possible. Such a structured definition serves as the groundwork for further investigation. - 2. Formulate a Hypothesis: A hypothesis in debugging is a testable explanation for the observed behavior. For instance, you might hypothesize: _"The data inconsistency occurs because a caching layer is serving stale data when certain user profiles are updated."_ The key is that this explanation must be falsifiable; if experiments don't support the hypothesis, it must be refined or discarded. - 3. Collect Evidence and Data: Evidence often includes logs, system metrics, error messages, and runtime traces. Similar to reviewing primary sources in academic research, treat your raw debugging data as crucial evidence. Evaluating these data points can reveal patterns. In our example, such patterns could be whether the bug correlates with specific caching mechanisms, increased memory usage, or database query latency. During this step, it's essential to approach data critically, just as you would analyze the quality and credibility of sources in a research literature review. Don't forget that even logs can be misleading, incomplete, or even incorrect, so cross-referencing multiple sources is key. - 4. Design and Run Experiments: Design minimal, controlled tests to confirm or refute your hypothesis. In our example, you may try disabling or shortening the cache's time-to-live (TTL) to see if more recent data is displayed correctly. By manipulating one variable at a time - such as cache invalidation intervals - you gain clearer insights into causation. Tools such as profilers, debuggers, or specialized test harnesses can help isolate factors and gather precise measurements. - 5. Analyze Results and Refine Hypotheses: If the experiment's outcome doesn't align with your hypothesis, treat it as a stepping stone, not a dead end. Adjust your explanation, form a new hypothesis, or consider additional variables (for example, whether certain API calls bypass caching). Each iteration should bring you closer to a better understanding of the bug's root cause. Remember, the goal is not to prove an initial guess right but to arrive at a verifiable explanation. - 6. Implement and Verify the Fix: Once you're confident in the identified cause, you can implement the fix. Verification doesn't stop at deployment - re-test under the same conditions and, if possible, beyond them. By confirming the fix in a controlled manner, you ensure that the solution is backed by evidence rather than wishful thinking. - Personally, I consider implementing end-to-end tests (e.g., with Playwright) that reproduce the bug and verify the fix to be a crucial part of this step. This both ensures that the bug doesn't reappear in the future due to changes in the codebase and avoids possible imprecisions of manual testing. Now, we can explore these steps in more detail, highlighting how the scientific method can guide us through the debugging process. Establishing Clear Debugging Questions (Formulating a Hypothesis) A hypothesis is a proposed explanation for a phenomenon that can be tested through experimentation. In a debugging context, that phenomenon is the bug or issue you're trying to resolve. Having a clear, falsifiable statement that you can prove or disprove ensures that you stay focused on the real problem rather than jumping haphazardly between possible causes. A properly formulated hypothesis lets you design precise experiments to evaluate whether your explanation holds true. To formulate a hypothesis effectively, you can follow these steps: 1. Clearly Identify the Symptom(s) Before forming any hypothesis, pin down the specific issue users are experiencing. For instance: - "Users intermittently see outdated profile information after updating their accounts." - "Some newly created user profiles don't reflect changes in certain parts of the application." Having a well-defined problem statement keeps your hypothesis focused on the actual issue. Just like a research question in science, the clarity of your symptom definition directly influences the quality of your hypothesis. 2. Draft a Tentative Explanation Next, convert your symptom into a statement that describes a _possible root cause_, such as: - "Data inconsistency occurs because the caching layer isn't invalidating or refreshing user data properly when profiles are updated." - "Stale data is displayed because the cache timeout is too long under certain load conditions." This step makes your assumption about the root cause explicit. As with the scientific method, your hypothesis should be something you can test and either confirm or refute with data or experimentation. 3. Ensure Falsifiability A valid hypothesis must be falsifiable - meaning it can be proven _wrong_. You'll struggle to design meaningful experiments if a hypothesis is too vague or broad. For example: - Not Falsifiable: "Occasionally, the application just shows weird data." - Falsifiable: "Users see stale data when the cache is not invalidated within 30 seconds of profile updates." Making your hypothesis specific enough to fail a test will pave the way for more precise debugging. 4. Align with Available Evidence Match your hypothesis to what you already know - logs, stack traces, metrics, and user reports. For example: - If logs reveal that cache invalidation events aren't firing, form a hypothesis explaining why those events fail or never occur. - If metrics show that data served from the cache is older than the configured TTL, hypothesize about how or why the TTL is being ignored. If your current explanation contradicts existing data, refine your hypothesis until it fits. 5. Plan for Controlled Tests Once you have a testable hypothesis, figure out how you'll attempt to _disprove_ it. This might involve: - Reproducing the environment: Set up a staging/local system that closely mimics production. For instance with the same cache layer configurations. - Varying one condition at a time: For example, only adjust cache invalidation policies or TTLs and then observe how data freshness changes. - Monitoring metrics: In our example, such monitoring would involve tracking user profile updates, cache hits/misses, and response times. These metrics should lead to confirming or rejecting your explanation. These plans become your blueprint for experiments in further debugging stages. Collecting and Evaluating Evidence After formulating a clear, testable hypothesis, the next crucial step is to gather data that can either support or refute it. This mirrors how scientists collect observations in a literature review or initial experiments. 1. Identify "Primary Sources" (Logs, Stack Traces, Code History): - Logs and Stack Traces: These are your direct pieces of evidence - treat them like raw experimental data. For instance, look closely at timestamps, caching-related events (e.g., invalidation triggers), and any error messages related to stale reads. - Code History: Look for related changes in your source control, e.g. using Git bisect. In our example, we would look for changes to caching mechanisms or references to cache libraries in commits, which could pinpoint when the inconsistency was introduced. Sometimes, reverting a commit that altered cache settings helps confirm whether the bug originated there. 2. Corroborate with "Secondary Sources" (Documentation, Q&A Forums): - Documentation: Check official docs for known behavior or configuration details that might differ from your assumptions. - Community Knowledge: Similar issues reported on GitHub or StackOverflow may reveal known pitfalls in a library you're using. 3. Assess Data Quality and Relevance: - Look for Patterns: For instance, does stale data appear only after certain update frequencies or at specific times of day? - Check Environmental Factors: For instance, does the bug happen only with particular deployment setups, container configurations, or memory constraints? - Watch Out for Biases: Avoid seeking only the data that confirms your hypothesis. Look for contradictory logs or metrics that might point to other root causes. You keep your hypothesis grounded in real-world system behavior by treating logs, stack traces, and code history as primary data - akin to raw experimental results. This evidence-first approach reduces guesswork and guides more precise experiments. Designing and Running Experiments With a hypothesis in hand and evidence gathered, it's time to test it through controlled experiments - much like scientists isolate variables to verify or debunk an explanation. 1. Set Up a Reproducible Environment: - Testing Environments: Replicate production conditions as closely as possible. In our example, that would involve ensuring the same caching configuration, library versions, and relevant data sets are in place. - Version Control Branches: Use a dedicated branch to experiment with different settings or configuration, e.g., cache invalidation strategies. This streamlines reverting changes if needed. 2. Control Variables One at a Time: - For instance, if you suspect data inconsistency is tied to cache invalidation events, first adjust only the invalidation timeout and re-test. - Or, if concurrency could be a factor (e.g., multiple requests updating user data simultaneously), test different concurrency levels to see if stale data issues become more pronounced. 3. Measure and Record Outcomes: - Automated Tests: Tests provide a great way to formalize and verify your assumptions. For instance, you could develop tests that intentionally update user profiles and check if the displayed data matches the latest state. - Monitoring Tools: Monitor relevant metrics before, during, and after each experiment. In our example, we might want to track cache hit rates, TTL durations, and query times. - Repeat Trials: Consistency across multiple runs boosts confidence in your findings. 4. Validate Against a Baseline: - If baseline tests manifest normal behavior, but your experimental changes manifest the bug, you've isolated the variable causing the issue. E.g. if the baseline tests show that data is consistently fresh under normal caching conditions but your experimental changes cause stale data. - Conversely, if your change eliminates the buggy behavior, it supports your hypothesis - e.g. that the cache configuration was the root cause. Each experiment outcome is a data point supporting or contradicting your hypothesis. Over time, these data points guide you toward the true cause. Analyzing Results and Iterating In scientific debugging, an unexpected result isn't a failure - it's valuable feedback that brings you closer to the right explanation. 1. Compare Outcomes to the hypothesis. For instance: - Did user data stay consistent after you reduced the cache TTL or fixed invalidation logic? - Did logs show caching events firing as expected, or did they reveal unexpected errors? - Are there only partial improvements that suggest multiple overlapping issues? 2. Incorporate Unexpected Observations: - Sometimes, debugging uncovers side effects - e.g. performance bottlenecks exposed by more frequent cache invalidations. Note these for future work. - If your hypothesis is disproven, revise it. For example, the cache may only be part of the problem, and a separate load balancer setting also needs attention. 3. Avoid Confirmation Bias: - Don't dismiss contrary data. For instance, if you see evidence that updates are fresh in some modules but stale in others, you may have found a more nuanced root cause (e.g., partial cache invalidation). - Consider other credible explanations if your teammates propose them. Test those with the same rigor. 4. Decide If You Need More Data: - If results aren't conclusive, add deeper instrumentation or enable debug modes to capture more detailed logs. - For production-only issues, implement distributed tracing or sampling logs to diagnose real-world usage patterns. 5. Document Each Iteration: - Record the results of each experiment, including any unexpected findings or new hypotheses that arise. - Through iterative experimentation and analysis, each cycle refines your understanding. By letting evidence shape your hypothesis, you ensure that your final conclusion aligns with reality. Implementing and Verifying the Fix Once you've identified the likely culprit - say, a misconfigured or missing cache invalidation policy - the next step is to implement a fix and verify its resilience. 1. Implementing the Change: - Scoped Changes: Adjust just the component pinpointed in your experiments. Avoid large-scale refactoring that might introduce other issues. - Code Reviews: Peer reviews can catch overlooked logic gaps or confirm that your changes align with best practices. 2. Regression Testing: - Re-run the same experiments that initially exposed the issue. In our stale data example, confirm that the data remains fresh under various conditions. - Conduct broader tests - like integration or end-to-end tests - to ensure no new bugs are introduced. 3. Monitoring in Production: - Even with positive test results, real-world scenarios can differ. Monitor logs and metrics (e.g. cache hit rates, user error reports) closely post-deployment. - If the buggy behavior reappears, revisit your hypothesis or consider additional factors, such as unpredicted user behavior. 4. Benchmarking and Performance Checks (If Relevant): - When making changes that affect the frequency of certain processes - such as how often a cache is refreshed - be sure to measure the performance impact. Verify you meet any latency or resource usage requirements. - Keep an eye on the trade-offs: For instance, more frequent cache invalidations might solve stale data but could also raise system load. By systematically verifying your fix - similar to confirming experimental results in research - you ensure that you've addressed the true cause and maintained overall software stability. Documenting the Debugging Process Good science relies on transparency, and so does effective debugging. Thorough documentation guarantees your findings are reproducible and valuable to future team members. 1. Record Your Hypothesis and Experiments: - Keep a concise log of your main hypothesis, the tests you performed, and the outcomes. - A simple markdown file within the repo can capture critical insights without being cumbersome. 2. Highlight Key Evidence and Observations: - Note the logs or metrics that were most instrumental - e.g., seeing repeated stale cache hits 10 minutes after updates. - Document any edge cases discovered along the way. 3. List Follow-Up Actions or Potential Risks: - If you discover additional issues - like memory spikes from more frequent invalidation - note them for future sprints. - Identify parts of the code that might need deeper testing or refactoring to prevent similar issues. 4. Share with Your Team: - Publish your debugging report on an internal wiki or ticket system. A well-documented troubleshooting narrative helps educate other developers. - Encouraging open discussion of the debugging process fosters a culture of continuous learning and collaboration. By paralleling scientific publication practices in your documentation, you establish a knowledge base to guide future debugging efforts and accelerate collective problem-solving. Conclusion Debugging can be as much a rigorous, methodical exercise as an art shaped by intuition and experience. By adopting the principles of scientific inquiry - forming hypotheses, designing controlled experiments, gathering evidence, and transparently documenting your process - you make your debugging approach both systematic and repeatable. The explicitness and structure of scientific debugging offer several benefits: - Better Root-Cause Discovery: Structured, hypothesis-driven debugging sheds light on the _true_ underlying factors causing defects rather than simply masking symptoms. - Informed Decisions: Data and evidence lead the way, minimizing guesswork and reducing the chance of reintroducing similar issues. - Knowledge Sharing: As in scientific research, detailed documentation of methods and outcomes helps others learn from your process and fosters a collaborative culture. Ultimately, whether you are diagnosing an intermittent crash or chasing elusive performance bottlenecks, scientific debugging brings clarity and objectivity to your workflow. By aligning your debugging practices with the scientific method, you build confidence in your solutions and empower your team to tackle complex software challenges with precision and reliability. But most importantly, do not get discouraged by the number of rigorous steps outlined above or by the fact you won't always manage to follow them all religiously. Debugging is a complex and often frustrating process, and it's okay to rely on your intuition and experience when needed. Feel free to adapt the debugging process to your needs and constraints, and as long as you keep the scientific mindset at heart, you'll be on the right track....

Svelte 5 is Here! cover image

Svelte 5 is Here!

Svelte 5 was finally released after a long time in development. Fortunately, we've been able to test it for some time, and now it has a stable release. Let's dig into its features and why this is such a significant change, even though Svelte 4 code is almost 100% compatible. Svelte syntax everywhere This is one of my favorite additions. Previously, Svelte syntax was limited to a component element. Refactoring code from a component and moving it to a JavaScript file worked differently. Now you can use the .svelte.js or .svelte.ts extension, which allows you to use the same syntax everywhere. It's important to note that it's a way to express that this is not just JS, and what you write may be compiled to something else, just like .svelte files are not just html even though they look very similar. Runes The introduction of runes is one of the most significant changes in Svelte. Many users felt attracted to variables being instantly reactive in previous versions. ` There was, however, a lot of magic underneath and a considerable amount of work from the compiler to make it behave reactively. $state In Svelte 5, a reactive variable has to be explicitly declared using the $state rune, which brings a clear distinction between what is reactive and what isn’t. ` In the previous code, $state is not an actual function being called; it's a hint for the compiler to do something special with this declaration. Rune names always start with a dollar sign ($) and do not need to be imported. However, there’s much more to the changes than just the way we declare reactive variables. Runes bring a lot of new features that make Svelte 5 a great improvement. In Svelte 5, objects or arrays use Proxies to allow for granular reactivity, meaning that individual properties in an object are reactive, even if they are nested objects or arrays. If you modify a property, it will only update that property and will not trigger an update on the whole object. It also supports triggering updates when methods like array.push are called. In previous versions, an assignment was required to trigger an update: ` To have a similar behavior of svelte 4 (no deep reactivity), use the $state.raw() rune. This syntax of .* is common for related features of a rune: $state.raw() will require an assignment to trigger reactivity. ` Because proxies are used, you may need to extract the underlying state instead of the proxy itself. In that case, $state.snapshot() should be used: ` $derived We will use $derived and $derived.by to declare a derived state. The two runes are essentially the same, except one allows us to use a function instead of an expression, allowing for more complex operations to calculate the derived values. ` $effect Effects are useful for running something triggered by a change in state. One of the things you'll note from the $effect rune is that dependencies don't need to be explicit. Those will be picked from reactive values read synchronously in the body of the effect function. ` Something to bear in mind is that these dependencies are picked each time the effect runs. The values read during the last run become the dependencies of the effect. ` Depending on the result of the random method, foo or bar will stop being a dependency of the effect. You should place them outside the condition so they can trigger reruns of the effect. *Variants* of the effect rune are $effect.pre, which runs before a DOM update, and $effect.tracking(), which checks for the context of the effect (true for an effect inside an effect or in the template). $props This rune replaces the export let keywords used in previous versions to define a component's props. To use the $props syntax, we can consider it to return an object with all the properties a component receives. We can use JavaScript syntax to destructure it or use the rest property if we want to retrieve every property not explicitly destructured.. ` $bindable If you want to mutate a prop so that the change flows back to the parent, you can use the $bindable prop to make it work in both directions. A parent component can pass a value to a child component, and the child component is able to modify it, returning the data back to the parent component. ` $inspect The $inspect rune only works in dev mode and will track dependencies deeply. By default, it will call console.log with the provided argument whenever it detects a change. To change the underlying function, use $inspect.with().with): ` $host The host rune gives access to the host element when compiling as a custom element: ` ` Other changes Another important change is that component events are just props in Svelte 5, so you can destructure them using the $props() rune: ` A special children property can be used to project content into a component instead of using slots. Inside the components, use the [@render[(https://svelte.dev/docs/svelte/@render) tag to place them. ` Optional chaining (?.) prevents from attempting to render it if no children are passed in. If you need to render different components in different places (named slots before Svelte 5, you can pass them as any other prop, and use @render with them. Snippets Snippets allow us to declare markup slices and render them conveniently using the render tag (@render). They can take any number of arguments. ` Snippets can also be passed as props to other components. ` ` Conclusion Some exciting changes to the Svelte syntax were introduced while, at the same time, maximum compatibility efforts were made. This was a massive rewrite with numerous improvements in terms of performance, bundle size, and DX. Besides that, a new CLI has been released, making the whole experience of starting a project or adding features delightful. If you haven't tried Svelte before, it's a great time to try it now....

Exploring Open Props and its Capabilities cover image

Exploring Open Props and its Capabilities

Exploring Open Props and its Capabilities With its intuitive approach and versatile features, Open Props empowers you to create stunning designs easily. It has the perfect balance between simplicity and power. Whether you're a seasoned developer or just starting, Open Props makes styling websites a breeze. Let's explore how Open Props can help your web development workflow. What is Open Props Open Props is a CSS library that packs a set of CSS variables for quickly creating consistent components using “Sub-Atomic” Styles. These web design tokens are crafted to help you get great-looking results from the start using consistent naming conventions and providing lots of possibilities out-of-the-box. At the same time, it's customizable and can be gradually adopted. Installing open props There are many ways to get started with open props, each with its advantages. The library can be imported from a CDN or installed using npm. You can import all or specific parts of it, and for greater control of what's bundled or not, you can use PostCSS to include only the variables you used. From Zero to Open Props Let's start with the simplest way to test and use open props. I'll create a simple HTML file with some structure, and we'll start from there. Create an index.html file. ` Edit the content of your HTML file. In this example, we’ll create a landing page containing a few parts: a hero section, a section for describing the features of a service, a section for the different pricing options available and finally a section with a call to action. We’ll start just declaring the document structure. Next we’ll add some styles and finally we’ll switch to using open props variables. ` To serve our page, we could just open the file, but I prefer to use serve, which is much more versatile. To see the contents of our file, let's serve our content. ` This command will start serving our site on port 3000. Our site will look something like this: Open-props core does not contain any CSS reset. After all, it’s just a set of CSS variables. This is a good start regarding the document structure. Adding open props via CDN Let's add open-props to our project. To get started, add: ` This import will make the library's props available for us to use. This is a set of CSS variables. It contains variables for fonts, colors, sizes, and many more. Here is an excerpt of the content of the imported file: ` The :where pseudo-class wraps all the CSS variables declarations, giving them the least specificity. That means you can always override them with ease. This imported file is all you need to start using open props. It will provide a sensible set of variables that give you some constraints in terms of what values you can use, a palette of colors, etc. Because this is just CSS, you can opt-out by not using the variables provided. I like these constraints because they can help with consistency and allow me to focus on other things. At the same time, you can extend this by creating your own CSS variables or just using any value whenever you want to do something different or if the exact value you want is not there. We should include some styles to add a visual hierarchy to our document. Working with CSS variables Let's create a new file to hold our styles. ` And add some styles to it. We will be setting a size hierarchy to headings, using open props font-size variables. Additionally, gaps and margins will use the size variables. ` We can explore these variables further using open-props’ documentation. It's simple to navigate (single page), and consistent naming makes it easy to learn them. Trying different values sometimes involves changing the number at the end of the variable name. For example: font-size-X, where X ranges from 0 to 8 (plus an additional 00 value). Mapped to font-sizes from 0.5rem up to 3.5rem. If you find your font is too small, you can add 1 to it, until you find the right size. Colors range from 0-12: –red-0 is the lightest one (rgb(255, 245, 245)) while –red-12 is the darkest (rgb(125, 26, 26)). There are similar ranges for many properties like font weight, size (useful for padding and margins), line height and shadows, to name a few. Explore and find what best fits your needs. Now, we need to include these styles on our page. ` Our page looks better now. We could keep adding more styles, but we'll take a shortcut and add some defaults with Open Props' built in normalized CSS file. Besides the core of open props (that contains the variables) there’s an optional normalization file that we can use. Let's tweak our recently added styles.css file a bit. Let’s remove the rules for headings. Our resulting css will now look like this. ` And add a new import from open-props. ` Open props provides a normalization file for our CSS, which we have included. This will establish a nice-looking baseline for our styles. Additionally, it will handle light/dark mode based on your preferences. I have dark mode set and the result already looks a lot better. Some font styles and sizes have been set, and much more. More CSS Variables Let's add more styles to our page to explore the variables further. I'd like to give the pricing options a card style. Open Props has a section on borders and shadows that we can use for this purpose. I would also like to add a hover effect to these cards. Also, regarding spacing, I want to add more margins and padding when appropriate. ` With so little CSS added and using many open props variables for sizes, borders, shadows, and easing curves, we can quickly have a better-looking site. Optimizing when using the CDN Open props is a pretty light package; however, using the CDN will add more CSS than you'll probably use. Importing individual parts of these props according to their utility is possible. For example, import just the gradients. ` Or even a subset of colors ` These are some options to reduce the size of your app if using the CDN. Open Props with NPM Open Props is framework agnostic. I want my site to use Vite. Vite is used by many frameworks nowadays and is perfect to show you the next examples and optimizations. ` Let's add a script to our package.json file to start our development server. ` Now, we can start our application on port 5173 (default) by running the following command: ` Your application should be the same as before, but we will change how we import open props. Stop the application and remove the open-props and normalize imports from index.html. Now in your terminal install the open-props package from npm. ` Once installed, import the props and the normalization files at the beginning of your styles.css file. ` Restart your development server, and you should see the same results. Optimizing when using NPM Let's analyze the size of our package. 34.4 kb seems a bit much, but note that this is uncompressed. When compressed with gzip, it's closer to 9 kb. Similar to what we did when using the CDN, we can add individual sections of the package. For example in our CSS file we could import open-props/animations or open-props/sizes. If this concerns you, don't worry; we can do much better. JIT Props To optimize our bundled styles, we can use a PostCSS plugin called posts-jit-props. This package will ensure that we only ship the props that we are using. Vite has support for PostCSS, so setting it up is straightforward. Let's install the plugin: ` After the installation finishes, let's create a configuration file to include it. ` The content of your file should look like this: ` Finally, remove the open-props/style import from styles.css. Remember that this file contains the CSS variables we will add "just in time". Our page should still look the same, but if we analyze the size of our styles.css file again, we can see that it has already been reduced to 13.2kb. If you want to know where this size is coming from, the answer is that Open Props is adding all the variables used in the normalize file + the ones that we require in our file. If we were to remove the normalize import, we would end up with much smaller CSS files, and the number of props added just in time would be minimal. Try removing commenting it out (the open-props/normalize import) from the styles.css file. The page will look different, but it will be useful to show how just the props used are added. 2.4kB uncompressed. That's a lot less for our example. If we take a quick look at our generated file, we can see the small list of CSS variables added from open props at the top of our file (those that we use later on the file). Open props ships with tons of variables for: - Colors - Gradients - Shadows - Aspect Ratios - Typography - Easing - Animations - Sizes - Borders - Z-Index - Media Queries - Masks You probably won't use all of these but it's hard to tell what you'll be using from the beginning of a project. To keep things light, add what you need as you go, or let JIT handle it for you. Conclusion Open props has much to offer and can help speed your project by leveraging some decisions upfront and providing a sensible set of predefined CSS Variables. We've learned how to install it (or not) using different methods and showcased how simple it is to use. Give it a try!...

Increasing development velocity with Cursor cover image

Increasing development velocity with Cursor

If you’re a developer, you’ve probably heard of Cursor by now and have either tried it out or are just curious to learn more about it. Cursor is a fork of VSCode with a ton of powerful AI/LLM-powered features added on. For around $20/month, I think it’s the best value in the AI coding space. Tech giants like Shopify and smaller companies like This Dot Labs have purchased Cursor subscriptions for their developers with the goal of increased productivity. I have been using Cursor heavily for a few months now and am excited to share how it’s impacted me personally. In this post, we will cover some of the basic features, use cases, and I’ll share some tips and tricks I’ve learned along the way. If you love coding and building like me, I hope this post will help you unleash some of the superpowers Cursor’s AI coding features make possible. Let’s jump right in! Cursor 101 The core tools of the Cursor tool belt are Autocomplete, Ask, and Agent. Feature: Autocomplete The first thing that got me hooked was Autocomplete. It just worked so much better than the tools I had used previously, like GitHub Copilot. It was quicker and smarter, and I could immediately notice the amount of keystrokes that it was saving me. This feature is great because it doesn’t really require any work or skilled prompting from the user. There are a couple of tricks for getting a little bit more out of it that I will share later, but for now, just enjoy the ride! Feature: Ask If you’ve interacted with AI/LLMs before, like ChatGPT - this is what the Ask feature is. It’s just a chat feature you can easily provide context to from your code base and choose which Model to chat with. This feature is best suited for just asking more general questions that you might have queried Google or Stack Overflow for in the past. It’s also good for planning how to implement a feature you’re working on. After chatting or planning, you can switch directly to Agent mode to pick up and take action on something you were cooking up in Ask mode. Here’s an example of planning a simple tic-tac-toe game implementation using the Ask feature: Feature: Agent Agent mode lets the AI model take the wheel and write code, make edits, or take other similar actions on your code base. The goal is that you can write prompts and give instructions, and the Agent can generate the code and build features or even entire applications for you. With great power comes great responsibility. Agents are a feature where the more you put into them, the more you get out. The more skilled you become in using them by providing better prompts and including the right context, you will continue to get better results. The AI doesn’t always get it right, but the fact that the models and the users are both getting better is exciting. Throughout this post, I will share the best use cases, tips, and tricks I have found using Cursor Agent. Here’s an example using the Agent to execute the implementation details of the tic-tac-toe game we planned using Ask: Core Concept: Context After understanding the features and the basics of prompting, context is the most important thing for getting the best results out of Cursor. In Cursor and in general, whenever you’re prompting a chat or an agent, you want to make sure that it has all the relevant information that it needs to provide an answer or result. Cursor, by default, always has some context of your code. It indexes your code base and usually keeps the open buffer in the context window at the very least. At the top left of the Ask or Agent panel, there is an @ button, and next to that are badges for all the current items that have been explicitly added to the context for the current session. The @ button has a dropdown that allows you to add files, folders, web links, past chats, git commits, and more to the context. Before you prompt, always make sure you add the relevant content it needs as context so that it has everything it needs to provide the best response. Settings and Rules Cursor has its own settings page, which you can access through Cursor → Settings → Cursor Settings. This is where you log in to your account, manage various features, and enable or disable models. In the General section, there is an option for Privacy Mode. This is one setting in particular I recommend enabling. Aside from that, just explore around and see what’s available. Models The model you use is just as important as your prompt and the context that you provide. Models are the underlying AI/LLM used to process your input. The most well-known is GPT-4o, the default model for ChatGPT. There are a lot of different models available, and Cursor provides access to most of them out of the box. Model pricing A lot of the most common models, like GPT-4o or Sonnet 3.5/3.7, are included in your Cursor subscription. Some models like o1 and Sonnet 3.7 MAX are considered premium models, and you will be billed for usage for these. Be sure to pay attention to which models you are using so you don’t get any surprise bills. Choosing a Model Some models are better suited for certain tasks than others. You can configure which models are enabled in the Cursor Settings. If you are planning out a big feature or trying to solve some complex logic issue, you may want to use one of the thinking models, like o1, o3-mini, or Deep Seek R1. For most coding tasks and as a good default, I recommend using Sonnet 3.5 or 3.7. The great thing about Cursor is that you have the options available right in your editor. The most important piece of advice that I can give in this post is to keep trying things out and experimenting. Try out different models for different tasks, get a feel for it, and find what works for you. Use cases Agents and LLM models are still far from perfect. That being said, there are already a lot of tasks they are very good at. The more effective you are with these tools, the more you will be able to get done in a shorter amount of time. Generating test cases Have some code that you would like unit tested? Cursor is very good at generating test cases and assertions for your code. The fewer barriers there are to testing a piece of code, the better the result you will get. So, try your best to write code that is easily testable! If testing the code requires some mocks or other pieces to work, do your best to provide it the context and instructions it needs before writing the tests. Always review the test cases! There could be errors or test cases that don’t make sense. Most of the time, it will get you pretty close to where you want to be. Here’s an example of using the Agent mode to install packages for testing and generate unit tests for the tic-tac-toe game logic: Generating documentation This is another thing we know AI models are good at - summarizing large chunks of information. Make sure it has the context of whatever you want to document. This one, in particular, is really great because historically, keeping documentation up to date is a rare and challenging practice. Here’s an example of using the Agent mode to generate documentation for the tic-tac-toe game: Code review There are a lot of up-and-coming tools outside of Cursor that can handle this. For example, GitHub now has Copilot integrated in pull requests for code reviews. It’s never a bad idea to have whatever change set you’re looking to commit reviewed and inspected before pushing it up to the remote, though. You can provide your unstaged changes or even specific commits as context to a Cursor Ask or Agent prompt. Getting up to speed in a new code base Being able to query a codebase with the power of LLM’s is truly fantastic. It can be a great help to get up to speed in a large new codebase quickly. Some example prompts: > Please provide an overview of this project and how to get started developing with it > I need to make some changes to the way that notifications are grouped in the UI, please provide a detailed analysis and pseudo code outlining how the grouping algorithm works If you have a question about the code base, ask Cursor! Refactoring Refactoring code in a code base is a much quicker process in Cursor. You can execute refactors depending on their scope in a couple of distinct ways. For refactors that don’t span a lot of files or are less complex, you can probably get away with just using the autocomplete. For example, if you make a change to something in a file and there are several instances of the same pattern following, the autocomplete will quickly pick up on this and help you tab through the changes. If you switch to another file, this information will still be in context and can be continued most of the time. For larger refactors spanning several files, using the Agent feature will most likely be the quickest way to get it done. Add all the files you plan to make changes to the Agent tab’s context window. Provide specific instructions and/or a basic example of how to execute the refactor. Let the Agent work, if it doesn’t get it exactly right initially, you can always give it corrections in a follow-up prompt. Generating new code/features This is the big promise of AI agents and the one with the most room for mixed results. My main recommendation here is to keep experimenting. Keep learning to prompt more effectively, compare results from different models, and pay attention to the results you get from each use case. I personally get the best results building new features in small, focused chunks of work. It can also be helpful to have a dialog with the Ask feature first to plan out the feature's details that the Agent can follow up on and implement. If there are existing patterns in your codebase for accomplishing certain things, provide this information in your prompts and make sure to add the relevant code to the context. For example, if you’re adding a new form to the web page and you have other similar forms that handle validation and making back-end calls in the same way, Cursor can base the code for the new feature on this. Example prompt: Generate a form for creating a new post, follow similar patterns from the create user profile form, and look to the post schema for the fields that should be included. Remember that you can always follow up with additional prompts if you aren’t quite happy with the results of the first.. If the results are close but need to be adjusted in some way, let the agent know in the next prompt. You may find that for some things, it just doesn’t do well yet. Mentally note these things and try to get to a place where you can intuit when to reach for the Agent feature or just write some of the code the old-fashioned way. Tips and tricks The more you use Cursor, the more you will find little ways to get more out of it. Here are some of the tips and patterns that I find particularly useful in my day-to-day work. Generating UI with screenshots You can attach images to your prompts that the models can understand using computer vision. To the left of the send button, there is a little button to attach an image from your computer. This functionality is incredibly useful for generating UI code, whether you are giving it an example UI as a reference for generating new UI in your application or providing a screenshot of existing UI in your application and prompting it to change details in reference to the image. Cursor Rules Cursor Rules allow you to add additional information that the LLM models might need to provide the best possible experience in your codebase. You can create global rules as well as project-specific ones. An example use case is if your project has some updated dependency with newer APIs than the one on which the LLM has been trained. I ran into this when adding Tailwind v4 to a project; the models are always generating code based on Tailwind v3 or earlier. Here’s how we can add a rules file to handle this use case: ` If you want to see some more examples, check out the awesome-cursorrules repository. Summary Learn to use Cursor and similar tools to enhance your development process. It may not give you actual superpowers, but it may feel like it. All the features and tools we’ve covered in this post come together to provide an amazing experience for developing all types of software and applications....

Let's innovate together!

We're ready to be your trusted technical partners in your digital innovation journey.

Whether it's modernization or custom software solutions, our team of experts can guide you through best practices and how to build scalable, performant software that lasts.

Prefer email? hi@thisdot.co