Enhancing Sentry's Suite of Debugging Tools with a Cutting Edge Replay Feature
Sentry’s Emerging Technologies team approached This Dot Labs to augment their team developing a new feature offering a visual replay of user interactions that would seamlessly fit in with Sentry’s portfolio of error and performance monitoring tools.
Overview
Sentry's Emerging Technologies team approached This Dot Labs to augment their team developing a new feature offering a visual replay of user interactions that would seamlessly fit in with Sentry's portfolio of error and performance monitoring tools.
Services Provided
Two experienced React developers from This Dot Labs joined Sentry's Emerging Technologies team to help build out a complex view powering the user session replay experience, and integrate touch points for the new feature across many pages in Sentry's React codebase. Our team became active participants in the product process, assisting with estimation and project planning, as well as highlighting potential new feature additions that would later become part of the product and a couple of enhancements to the Replay SDK.
Tech-stack
The Replay feature was built on top of the existing open-source dashboard offered by Sentry, which is built with React and Sentry's custom component library used across their ecosystem. The team made a couple of enhancements to the browser SDK for Replay to help with data capture reliability and performance insight.
This Dot Labs is a development consultancy focused on providing staff augmentation, architectural guidance, and consulting to companies.
We help implement and teach modern web best practices with technologies such as React, Angular, Vue, Web Components, GraphQL, Node, and more.

Sentry offers a self-hosted and cloud-based application monitoring tool that is compatible with over thirty coding languages and helps software teams address bugs and identify potential performance bottlenecks.
This Dot's development team worked side-by-side with our own product development group, helping us bring a key product offering to market on time and with a high quality bar.
Ben Vinegar VP, Emerging Technology - Sentry
Optimizing Data to Promote Efficiency and User Experience
The Sentry Replay team was faced with the complex task of displaying a several key features in a relatively small amount of digital canvas while also integrating it with other aspects of the application. Our team worked with the Sentry design team to align on how to achieve all the desired outcomes.
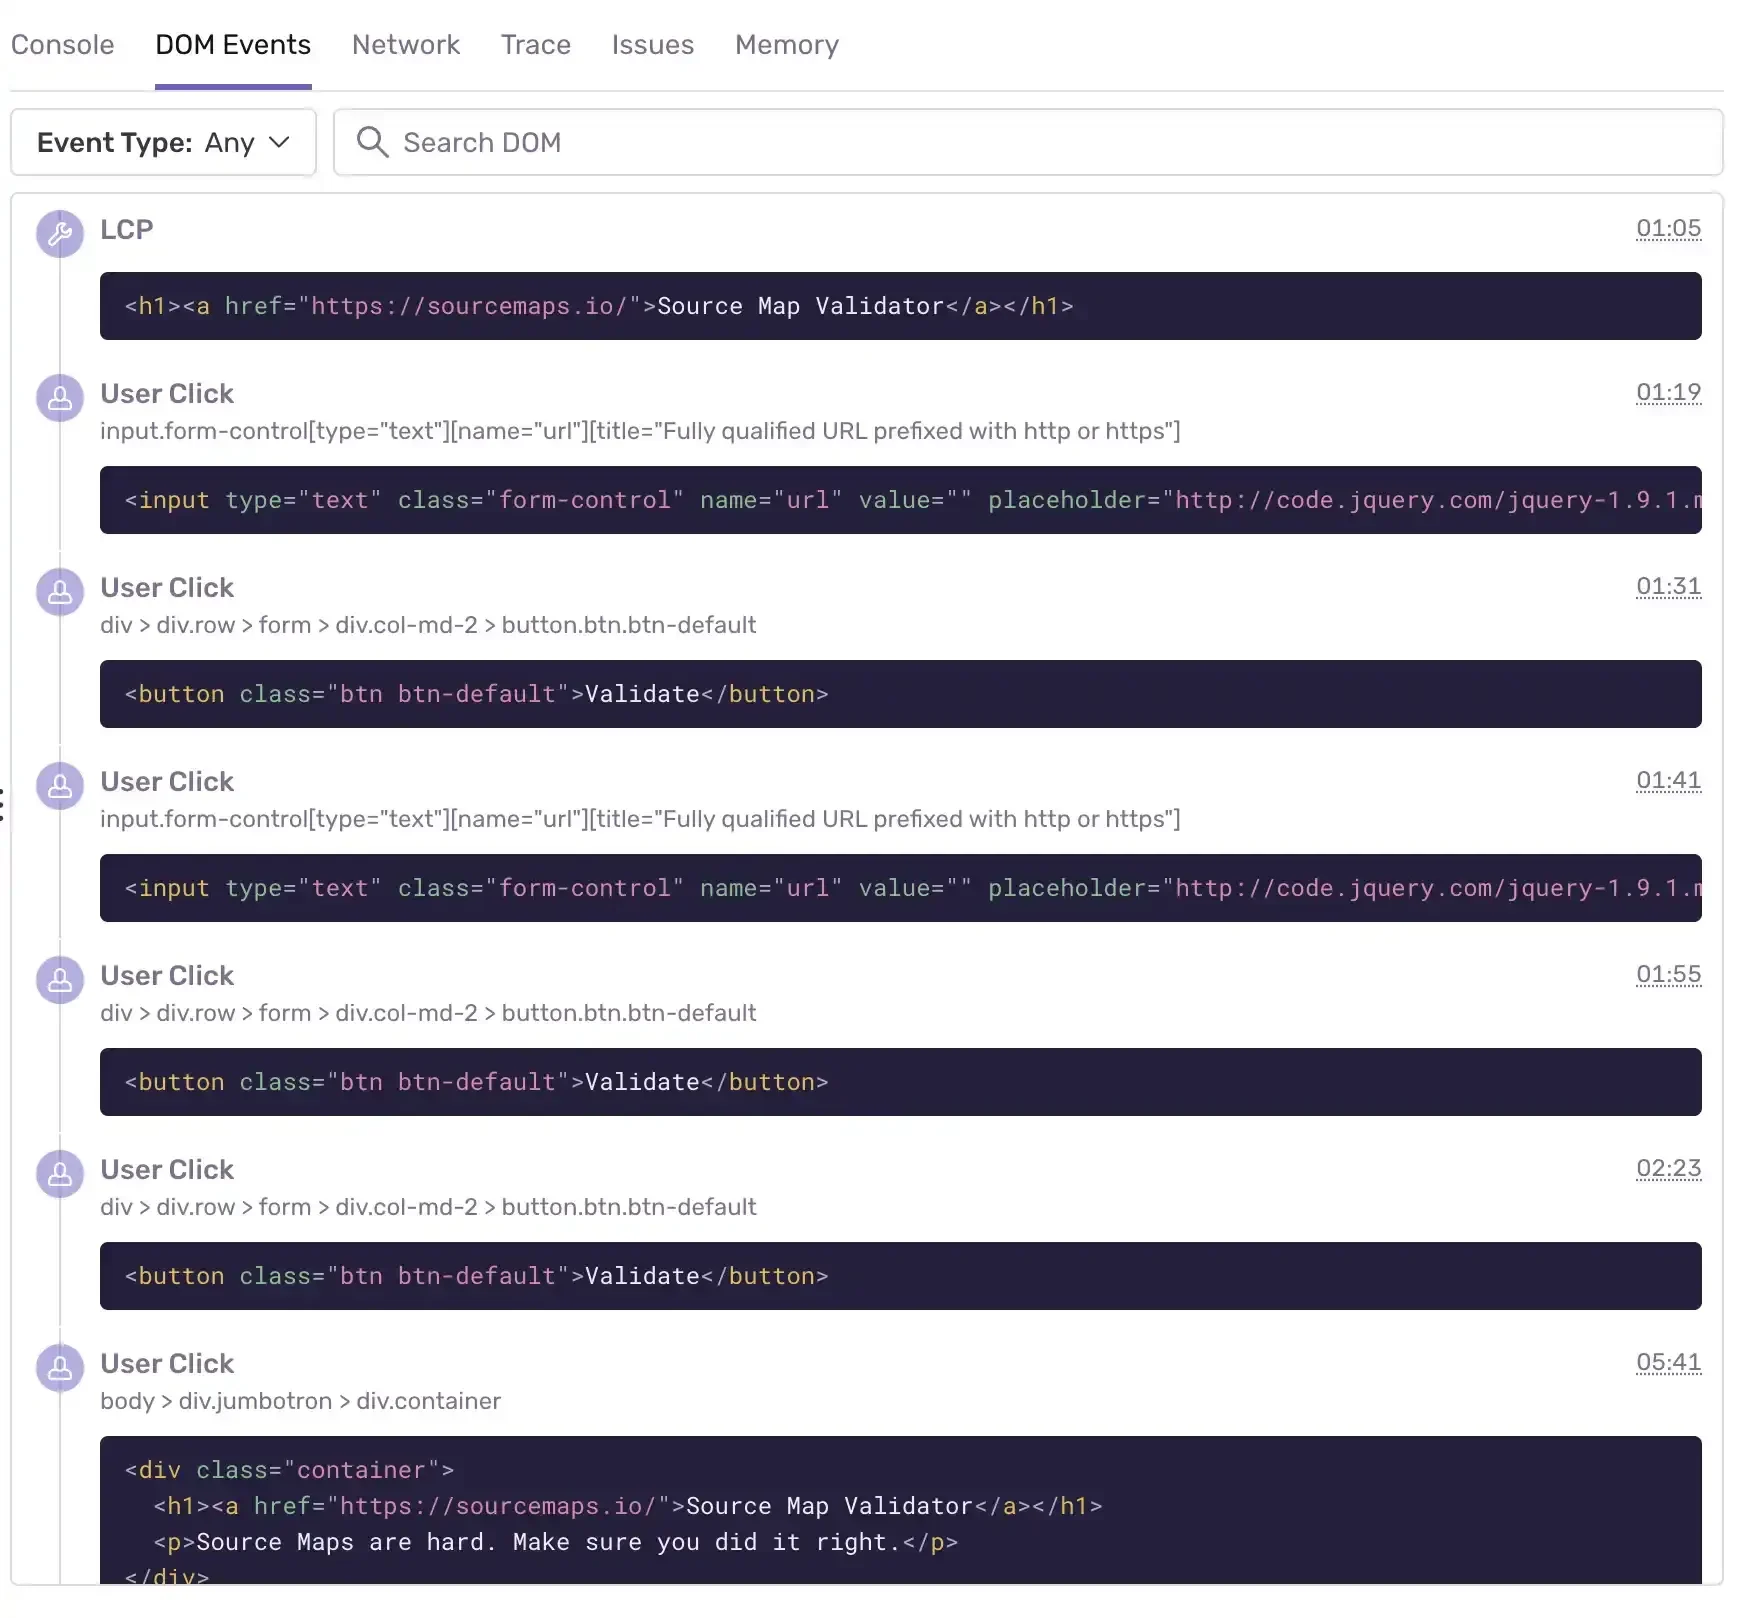
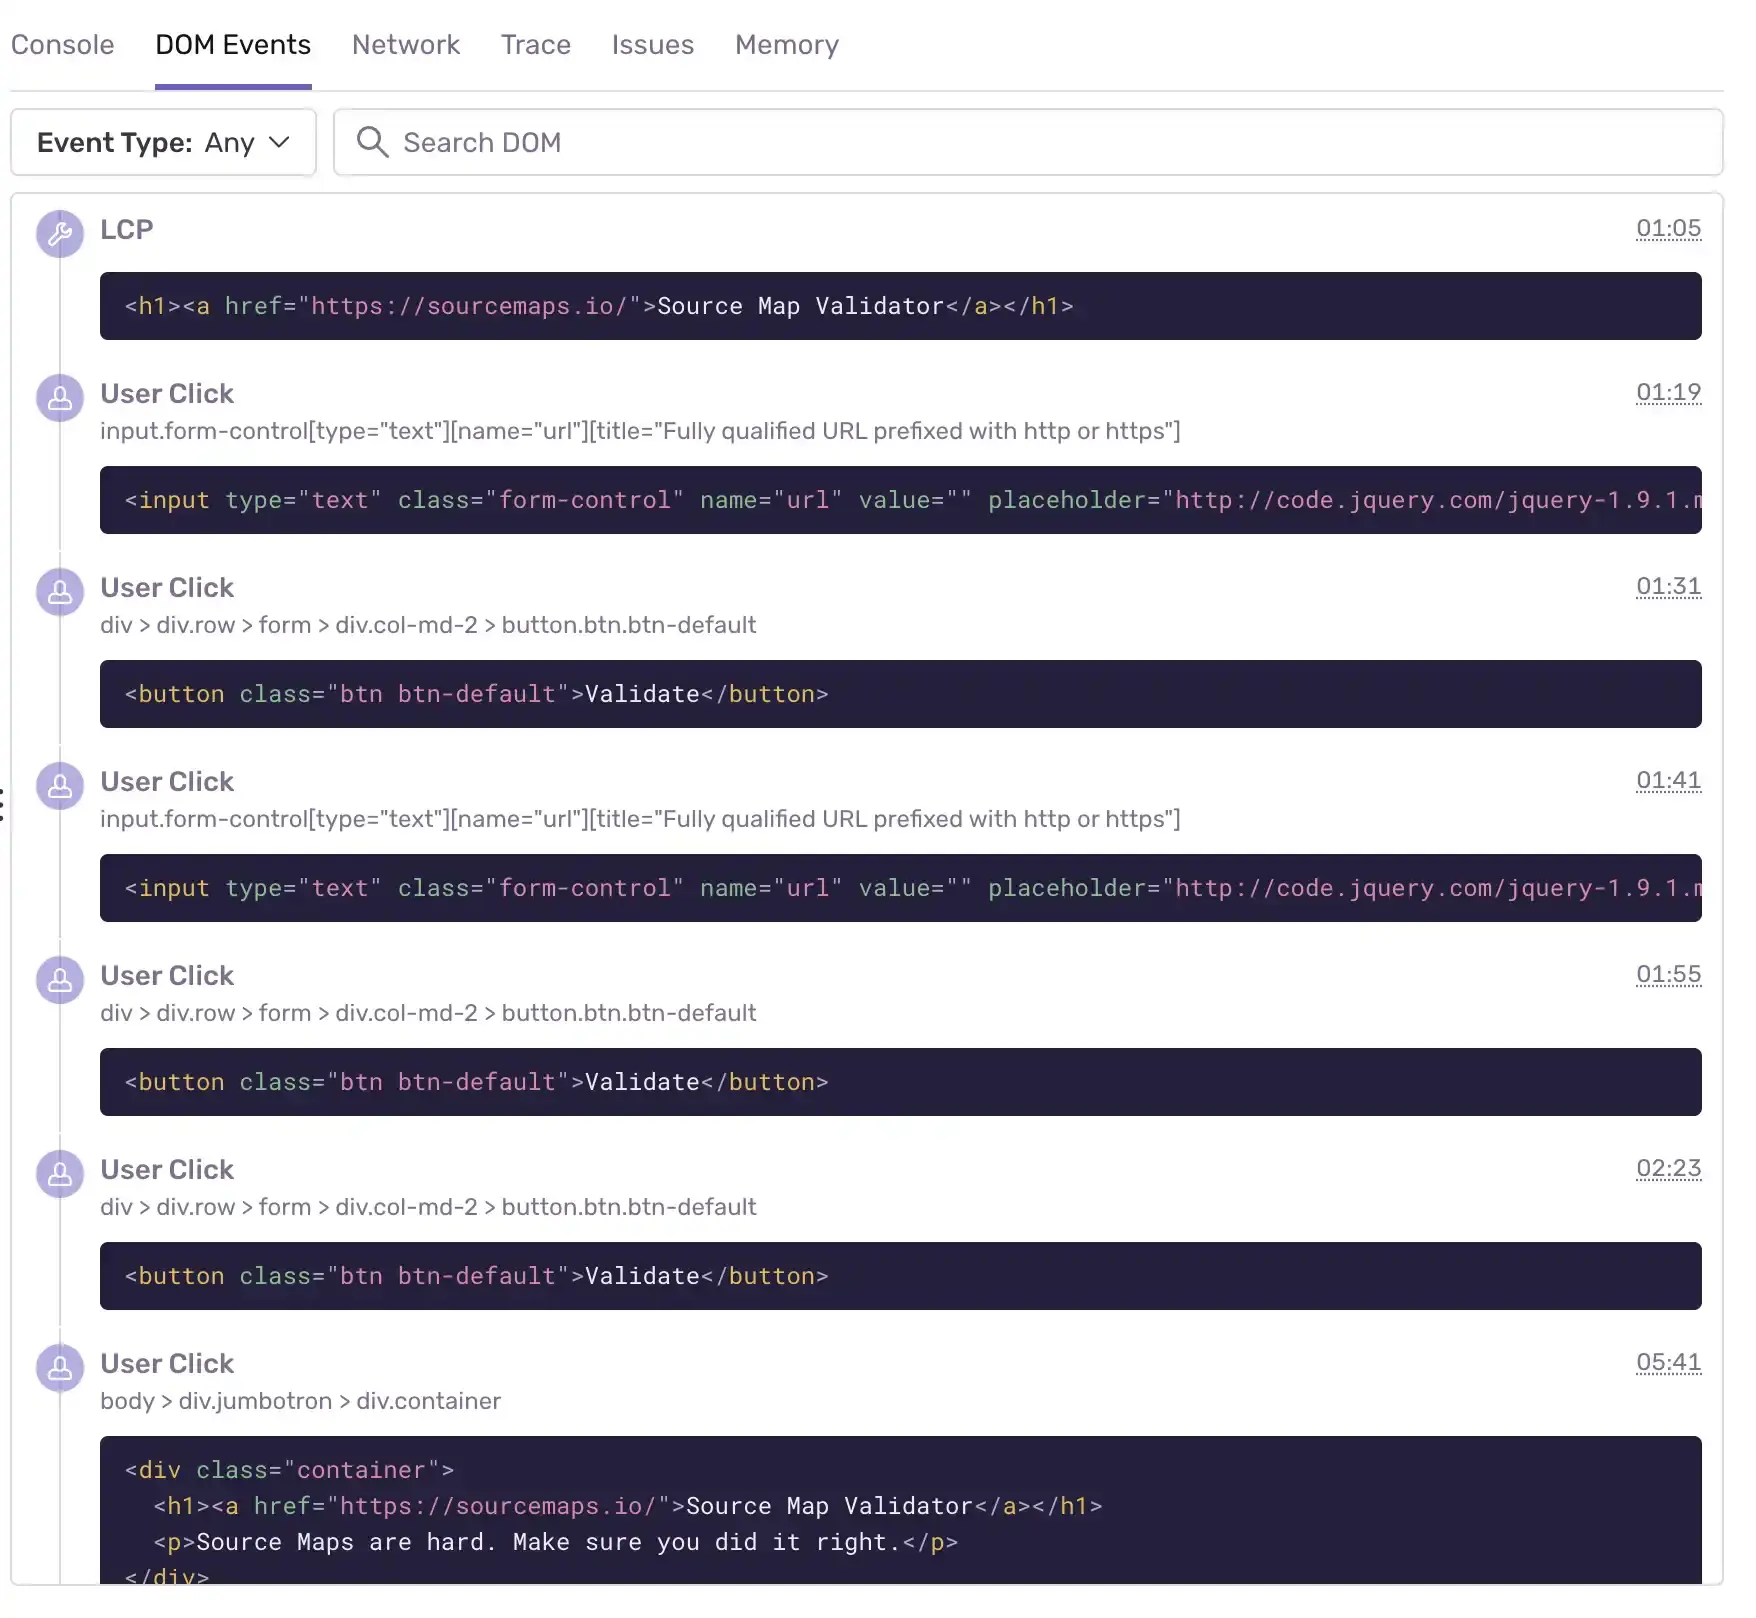
Sentry Replay seeks to enable deeper debugging context and one of these tools is DOM Events. Our team developed the interface that allows users to inspect augmented DOM events, like user clicks or keyboard inputs, to help better understand targeted events. Users can also click on the Replay timeline feature at key points of interest and find the related DOM Event associated to that moment in time. This feature was especially challenging due to the volume of data that needed to be fetched and displayed as some users have thousands of events while others only have a few. Displaying these events was equally challenging as we had to extract the HTML of the events from the recording's UI state. To avoid performance issues, the team needed to perform several optimizations to give the best possible user experience such as optimized data prefetching and other mechanisms to avoid data overfetching.
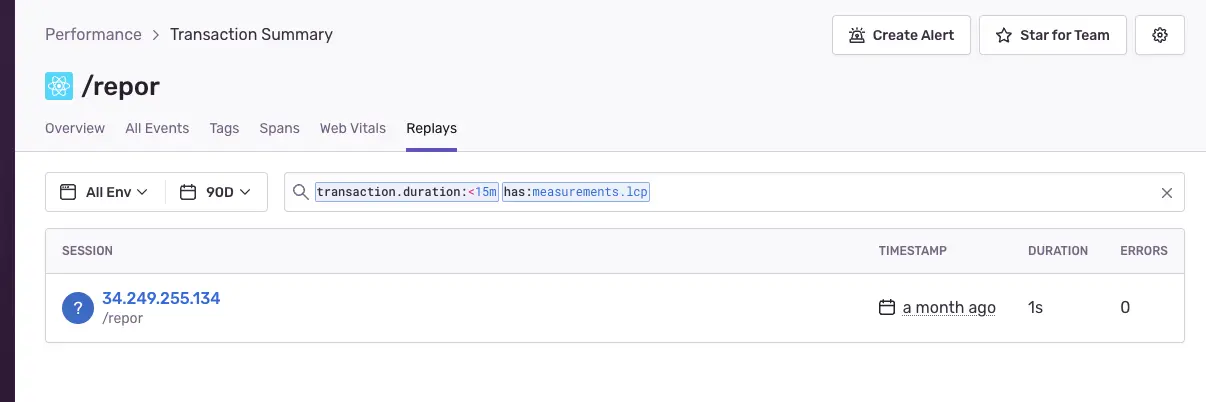
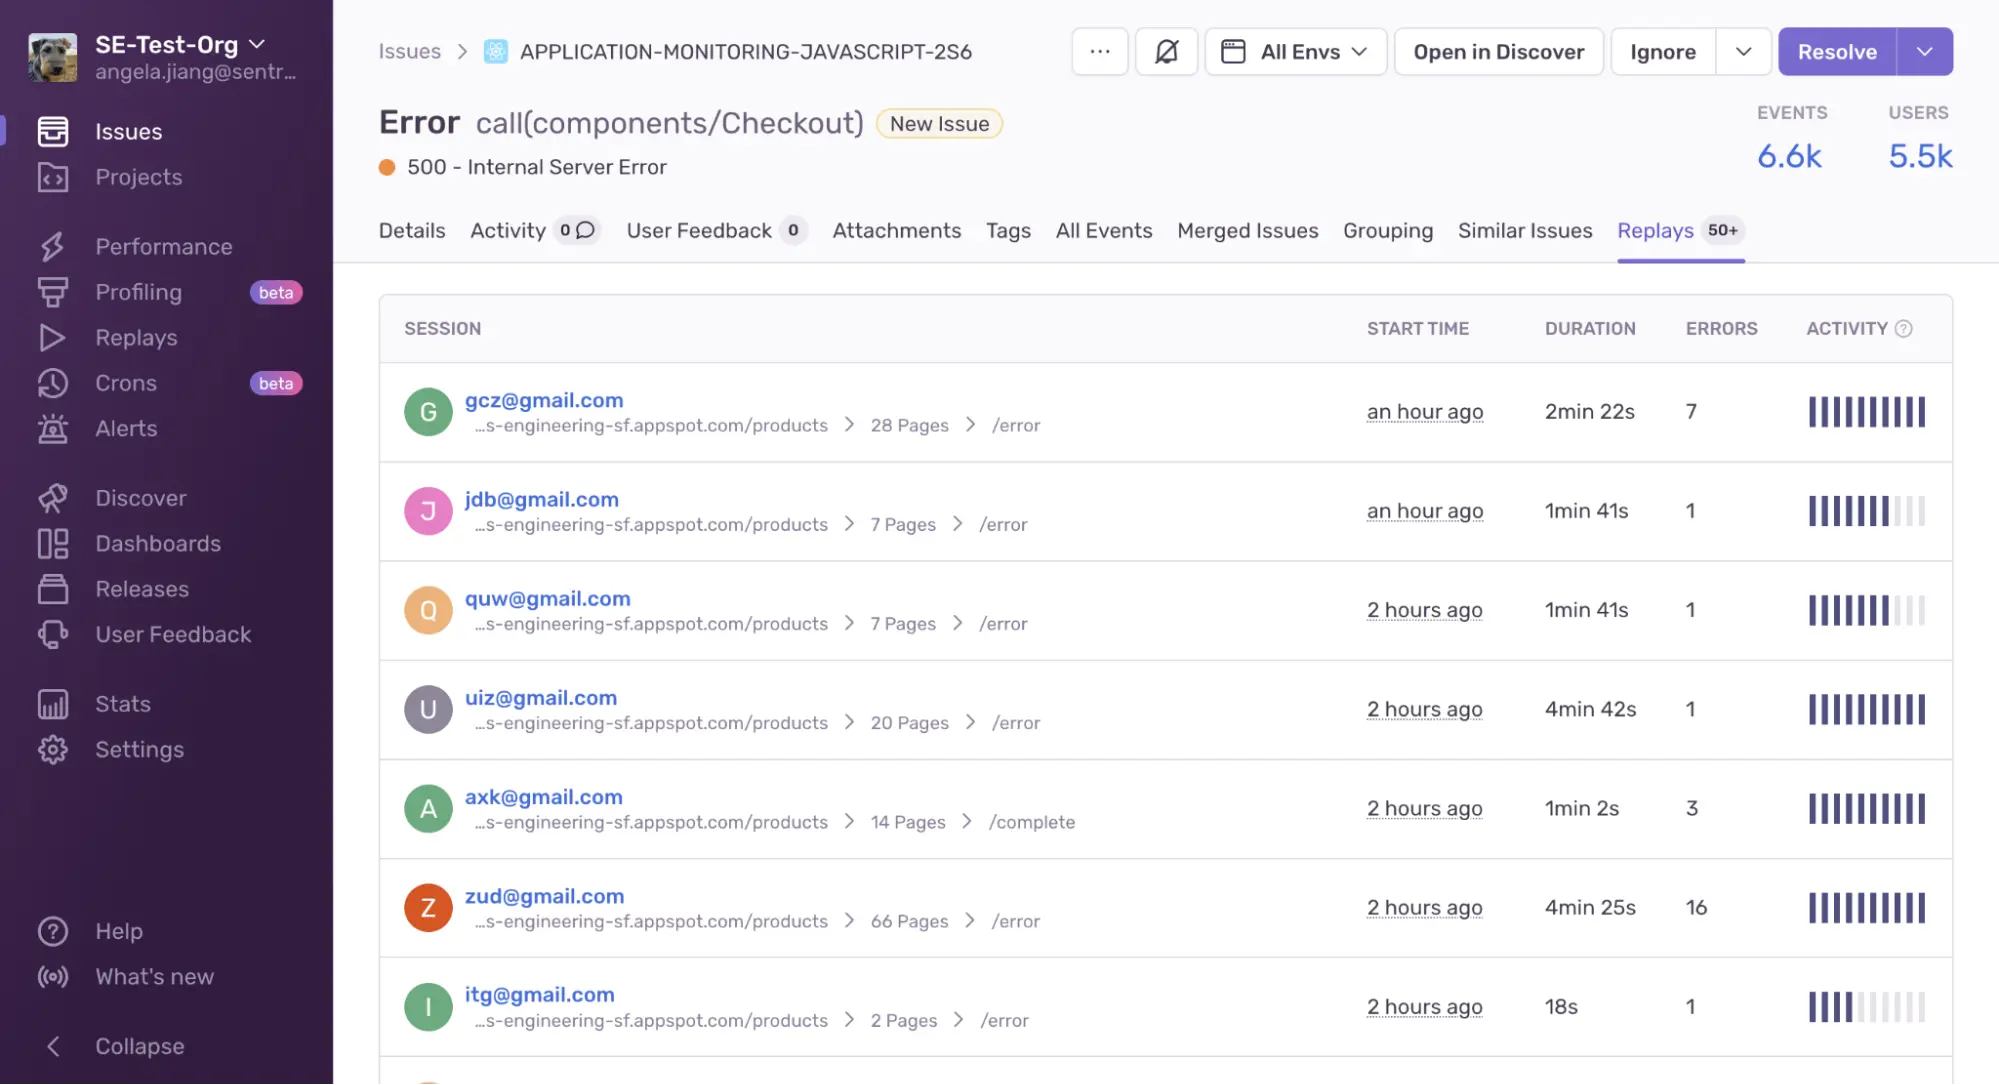
The Sentry Dashboard is a powerful tool for also inspecting performance and bug reports. Replay enhances this offering by allowing developers to understand the user story behind a given bug, specifically, “what actions led to a failure?” Replays integrate nicely into all these other product offerings. Our team implemented the interfaces in the performance insights dashboard for connecting performance summaries to replays. Instead of finding events and the going to find their related replays in different parts of the application, the team created a new tab that links the performance summaries directly to the replay associated with it. This helps with Replay discoverability and enhances the debugging process through keen insights this feature provides.
Enhancing the Replay SDK for Reliability and Performance Insights
The Sentry Replay SDK is used to collect data from a user's browser session and then reconstructed in the Sentry Dashboard User Interface. Our team assisted in making improvements to this tool that helped with the reliability of data capture and insights into application performance.
The Replay SDK has to upload data from a recording to the Sentry servers. However, under certain network conditions, this upload can fail leading to unreliable data and a spotty replay. To help alleviate this condition, our team added retry logic with a backoff timer for the uploads. This change to the SDK causes uploads to retry failures up to 5 times with maximum backoff timer of 25 seconds. While this does not solve all issues with data capture as related to network conditions, this does reduce the amount of lost bytes leading to better playback experiences.
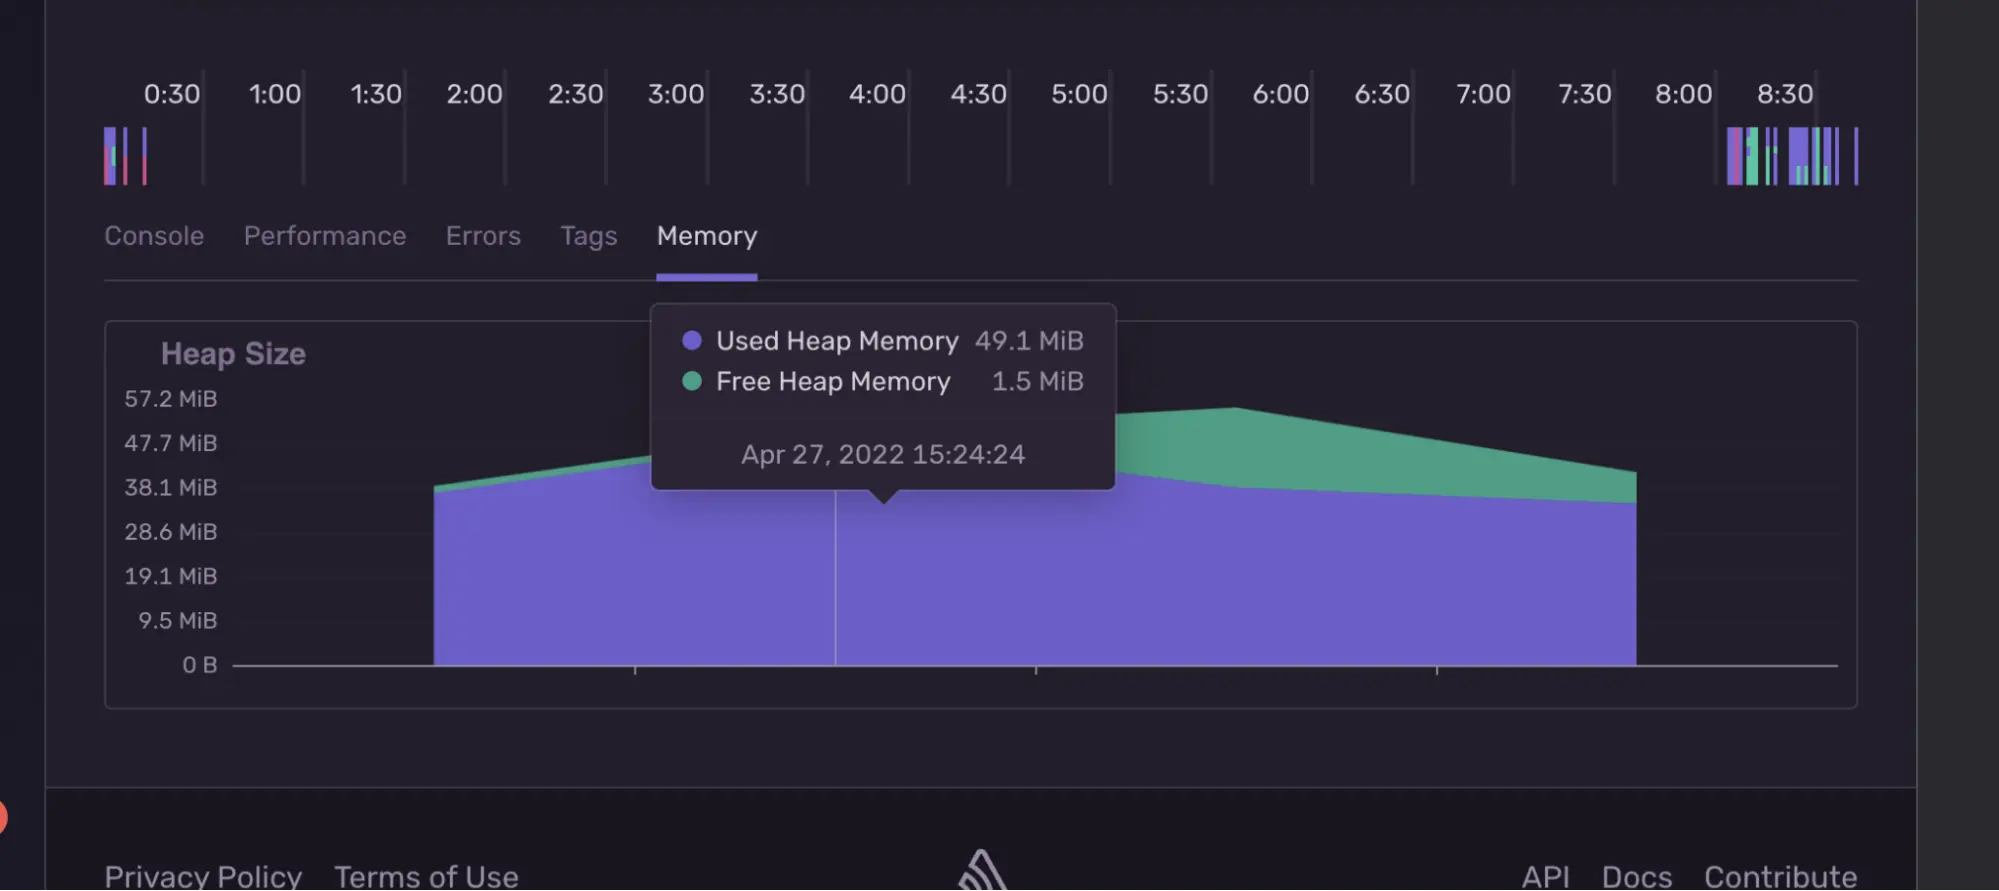
Additionally, the team added support for tracking memory usage throughout a replay session. This feature was to help support the memory tab display. Unfortunately, this feature is not available for all replays as the memory capture only works on Chrome due to browser API limitations. This feature allows developers to better understand application memory usage and performance and ultimately create better experiences for their consumers.

Let's innovate together!
We're ready to be your trusted technical partners in your digital innovation journey.
Whether it's modernization or custom software solutions, our team of experts can guide you through best practices and how to build scalable, performant software that lasts.