
Skip to content

Migrating from REST to GraphQL

This article was written over 18 months ago and may contain information that is out of date. Some content may be relevant but please refer to the relevant official documentation or available resources for the latest information.

Introduction

GraphQL has been gaining a lot of traction with enterprises and startups for their application data layers. Historically, the web has been built using REST and SOAP APIs which have served their purpose successfully for years, but as applications have gotten more complicated and data has become richer, these solutions have created friction in developing performant software quickly.

In this article, we'll briefly discuss some of the problems with traditional API solutions, the benefits of migrating to GraphQL, and the strategy for migrating to a GraphQL solution.

Traditional API Problems

In traditional API systems, we typically suffer from a few common issues:

  1. Data under-fetching or n+1 fetching
  2. Data over-fetching
  3. All-or-nothing Responses
  4. Lack of batch support

Data Under-fetching

Traditional resources require us to request data on a per-entity basis, e.g. only users or only posts. For example, using REST, if we want to get some user details and their posts, we'd have to make the following requests:

  1. GET /users/1
  2. GET /users/1/posts

Data Over-fetching

Conversely, when we request certain data, it will give us all the available information including data we might not care about. From our previous example, we might only want a user's name and username but the response might provide us their creation time and bio.

All-or-nothing Responses

However, if there's an error somewhere in this process, we might not get any data. Instead, we receive an HTTP status code informing us of a failure with an error message but none of the data that was fetchable.

Lack of Batch Support

Finally, for our more complex page, we might need to run multiple requests that can be parallelized but traditional APIs don't support this behavior out of the box. Dashboards, for example, might need sales and marketing data which will require our clients to make two separate requests to our server and wait on results before displaying that data causing perceived slowness in our application.

The GraphQL Advantage

Out of the box, GraphQL solves all of these described issues due to its declarative querying syntax and data handling. When you fetch data, you can request the exact data you need, and using the connection among entities, you can retrieve those relationships in a single request. If any of the data fails to fetch, GraphQL will still tell you about the data that was successfully retrieved and about the failures in fetching the other data, allowing you to show your users data regardless of failures. GraphQL also allows you to group multiple operations in a single request and fetch all data from a single request, thus reducing the number of round trips to your server and increasing perceived speed of your application.

In addition to these features, GraphQL creates a single gateway for your clients, reducing friction in team communication around how data should be fetched. Your API is now abstracted away behind a single endpoint that also provides documentation on how to use it.
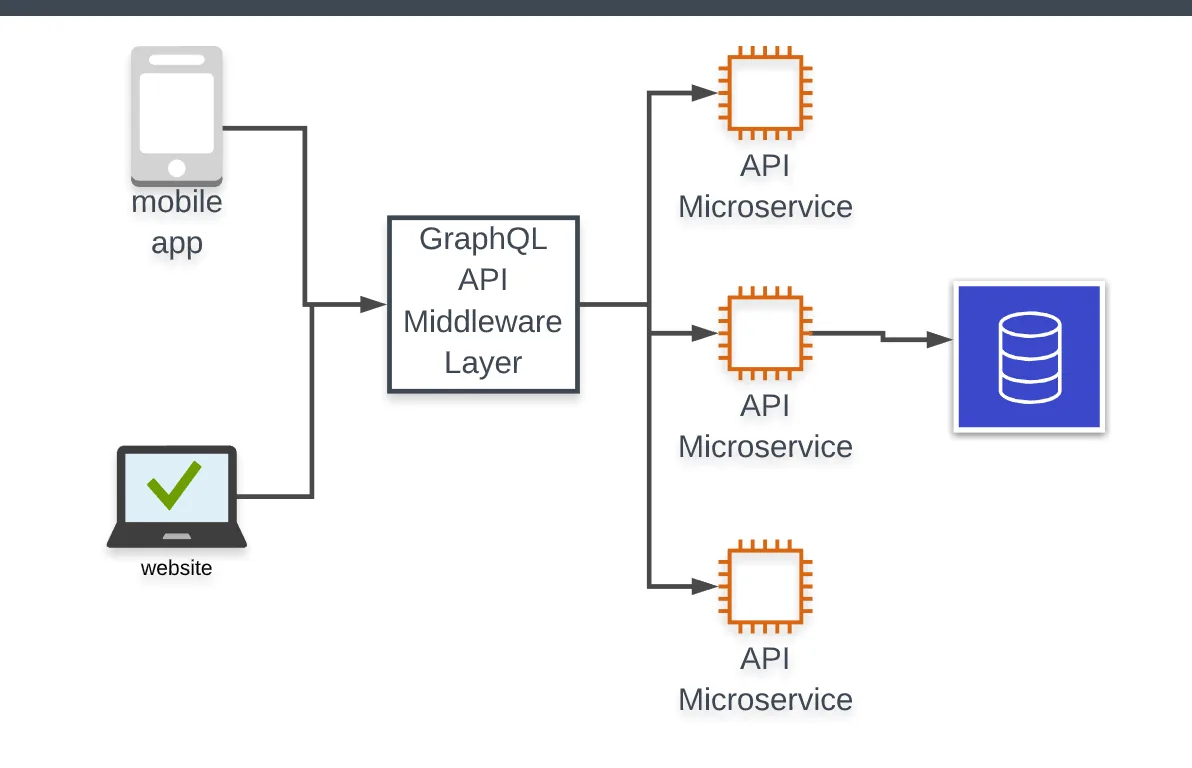
GraphQL Architecture

Given all these advantages, it's no wonder teams are moving to GraphQL, but it leaves the question of: how?

Migration Strategy

The GraphQL migration strategy is incremental so you don't have to slow down development to port over existing data or endpoints until you're ready to opt into those changes.

0. Before you begin

Before you start migration, here are some suggestions to think about as you're building new features or modifying the system in any way.

Don't build any new REST endpoints. Any new REST work is going to be additional GraphQL work later. Do yourself a favor and build it in GraphQL already.

Don't maintain your current REST endpoints. Porting REST endpoints to GraphQL is simple and GraphQL will provide you more functionality to build the exact behavior you want.

Leverage your existing REST endpoints to prototype quickly. You can use your existing REST API to power your GraphQL implementation. This won't be sustainable or performant long term, but it's a great way to get started.

1. Pick your GraphQL Implementation

Apollo and Relay are the two most popular fullstack GraphQL solutions, but you can also build your own solutions. Regardless of what you use, you'll use this to implement your server endpoint and connect to it with your client. All GraphQL requests go through a single endpoint, so once this is up and running, you can connect to it and begin porting functionality.

2. Select your first feature to build or port

With our server, we can start adding to it. Following our earlier example, let's migrate user posts.

3. Define your schema types

Now that we've decided on user posts, we have two routes here: (1) migrate users and posts or (2) migrate posts with a filter on user. For this, we're going to migrate posts and filter on user ID for now. To start, we'll define our post type in the schema and define its query type:

type Post {
  id: ID!
  userId: ID!
  content: String!
}

type Query {
  posts(userId: ID): [Post]
}

We now have a Post type that has an id and content and knows which user it belongs to. Additonally, we have a query called Posts that optionally accepts a userId as a filter and returns a list of Posts. It's important to note that it is semantically incorrect in GraphQL to expose the userId as a field. Instead, we should connect a post to its user and expose that entity relation, but those will be choices you make as you design your API.

4. Build our data resolver

Now, we need to connect our schema type and query to our data. For this, we'll use a resolver. The following syntax will vary slightly pending your server implementation, but using JavaScript and the GraphQL specification, we'd end up with the following resolver object:

const fetch = require('node-fetch');

export const resolvers = {
  Query: {
    posts: async (obj, args, context) => {
      const { API_URL } = process.env;
      const { userId } = args;

      if (userId){
        const response = await fetch (`${API_URL}/users/${userId}/posts`);
        return await response.json();
      }

      const response = await fetch (`${API_URL}/posts`);
      return await response.json();
    },
  }
};

If the userId is present in the query arguments, we use our existing REST API to fetch the posts by user, but if no userId is provided, we use the posts route directly. Now, we can make the following request on the frontend to retrieve our data:

query UserPosts($userId: ID!) {
  posts(userId: $userId) {
    id
    content
  }
}

I chose to use node-fetch for my implementation because it was simple, but you can use any HTTP library of your choice. However, if you're in the Apollo ecosystem, they've built a RESTDataSource library that will create an extension to your GraphQL implementation for handling resolvers to microservice APIs that can setup the boilerplate for that service so you only worry about fetching the data.

5. Next Steps

Extending Our Graph

Now that we have our data integrated, we need to complete the graph by connecting related types. Instead of Post having a userId, it can have a User and fetch the author details directly from the same query, e.g.

query UserPosts($userId: ID!) {
  posts(userId: $userId) {
    id
    content
    user {
      id
      avatarUrl
      displayName
    }
  }
}

Monoliths

Because we now have queries and types with full control of our schema, we can update our resolver functionality to rely on the codebase and not our REST API abstraction which will give us some added perfromance benefits. We can keep stitching together new types and extend our API further.

Microservices

GraphQL and microservices go hand-in-hand pretty well. GraphQL supports schema stitching, which allows us to build individual GraphQL APIs in our microservices and then combine them to make up our larger interface. Now, instead of configuring our clients to define all the different connections to different services, our GraphQL server understands where to collect all the data from, simplifying the amount of information the frontend needs to know about in order to complete requests.

Performance

A major downside to GraphQL can be the server-side overfetching, or n+1 problem. Because GraphQL doesn't know exactly how data is structured in the database, it cannot optimize for redundant requests in the graph tree. However, the GraphQL DataLoader library is here to solve exactly that. It determines any data that's already been fetched and caches for use in any sub-query to follow.

Conclusion

With all this power, it's no wonder GraphQL is picking up so much steam in the community. That being said, GraphQL isn't for everyone or might not be a good solution for your team today. However, I would suspect lots of future APIs we rely upon will start utilizing GraphQL more heavily and we'll see a trend away from traditional REST. Hopefully, you've seen the opportunity of GraphQL in your codebase and how it will help your team deliver quality products faster, and you can have a conversation with your team about a possible migration.


This Dot is a consultancy dedicated to guiding companies through their modernization and digital transformation journeys. Specializing in replatforming, modernizing, and launching new initiatives, we stand out by taking true ownership of your engineering projects.

We love helping teams with projects that have missed their deadlines or helping keep your strategic digital initiatives on course. Check out our case studies and our clients that trust us with their engineering.

You might also like

The Importance of a Scientific Mindset in Software Engineering: Part 2 (Debugging) cover image

The Importance of a Scientific Mindset in Software Engineering: Part 2 (Debugging)

The Importance of a Scientific Mindset in Software Engineering: Part 2 (Debugging) In the first part of my series on the importance of a scientific mindset in software engineering, we explored how the principles of the scientific method can help us evaluate sources and make informed decisions. Now, we will focus on how these principles can help us tackle one of the most crucial and challenging tasks in software engineering: debugging. In software engineering, debugging is often viewed as an art - an intuitive skill honed through experience and trial and error. In a way, it is - the same as a GP, even a very evidence-based one, will likely diagnose most of their patients based on their experience and intuition and not research scientific literature every time; a software engineer will often rely on their experience and intuition to identify and fix common bugs. However, an internist faced with a complex case will likely not be able to rely on their intuition alone and must apply the scientific method to diagnose the patient. Similarly, a software engineer can benefit from using the scientific method to identify and fix the problem when faced with a complex bug. From that perspective, treating engineering challenges like scientific inquiries can transform the way we tackle problems. Rather than resorting to guesswork or gut feelings, we can apply the principles of the scientific method—forming hypotheses, designing controlled experiments, gathering and evaluating evidence—to identify and eliminate bugs systematically. This approach, sometimes referred to as "scientific debugging," reframes debugging from a haphazard process into a structured, disciplined practice. It encourages us to be skeptical, methodical, and transparent in our reasoning. For instance, as Andreas Zeller notes in the book _Why Programs Fail_, the key aspect of scientific debugging is its explicitness: Using the scientific method, you make your assumptions and reasoning explicit, allowing you to understand your assumptions and often reveals hidden clues that can lead to the root cause of the problem on hand. Note: If you'd like to read an excerpt from the book, you can find it on Embedded.com. Scientific Debugging At its core, scientific debugging applies the principles of the scientific method to the process of finding and fixing software defects. Rather than attempting random fixes or relying on intuition, it encourages engineers to move systematically, guided by data, hypotheses, and controlled experimentation. By adopting debugging as a rigorous inquiry, we can reduce guesswork, speed up the resolution process, and ensure that our fixes are based on solid evidence. Just as a scientist begins with a well-defined research question, a software engineer starts by identifying the specific symptom or error condition. For instance, if our users report inconsistencies in the data they see across different parts of the application, our research question could be: _"Under what conditions does the application display outdated or incorrect user data?"_ From there, we can follow a structured debugging process that mirrors the scientific method: - 1. Observe and Define the Problem: First, we need to clearly state the bug's symptoms and the environment in which it occurs. We should isolate whether the issue is deterministic or intermittent and identify any known triggers if possible. Such a structured definition serves as the groundwork for further investigation. - 2. Formulate a Hypothesis: A hypothesis in debugging is a testable explanation for the observed behavior. For instance, you might hypothesize: _"The data inconsistency occurs because a caching layer is serving stale data when certain user profiles are updated."_ The key is that this explanation must be falsifiable; if experiments don't support the hypothesis, it must be refined or discarded. - 3. Collect Evidence and Data: Evidence often includes logs, system metrics, error messages, and runtime traces. Similar to reviewing primary sources in academic research, treat your raw debugging data as crucial evidence. Evaluating these data points can reveal patterns. In our example, such patterns could be whether the bug correlates with specific caching mechanisms, increased memory usage, or database query latency. During this step, it's essential to approach data critically, just as you would analyze the quality and credibility of sources in a research literature review. Don't forget that even logs can be misleading, incomplete, or even incorrect, so cross-referencing multiple sources is key. - 4. Design and Run Experiments: Design minimal, controlled tests to confirm or refute your hypothesis. In our example, you may try disabling or shortening the cache's time-to-live (TTL) to see if more recent data is displayed correctly. By manipulating one variable at a time - such as cache invalidation intervals - you gain clearer insights into causation. Tools such as profilers, debuggers, or specialized test harnesses can help isolate factors and gather precise measurements. - 5. Analyze Results and Refine Hypotheses: If the experiment's outcome doesn't align with your hypothesis, treat it as a stepping stone, not a dead end. Adjust your explanation, form a new hypothesis, or consider additional variables (for example, whether certain API calls bypass caching). Each iteration should bring you closer to a better understanding of the bug's root cause. Remember, the goal is not to prove an initial guess right but to arrive at a verifiable explanation. - 6. Implement and Verify the Fix: Once you're confident in the identified cause, you can implement the fix. Verification doesn't stop at deployment - re-test under the same conditions and, if possible, beyond them. By confirming the fix in a controlled manner, you ensure that the solution is backed by evidence rather than wishful thinking. - Personally, I consider implementing end-to-end tests (e.g., with Playwright) that reproduce the bug and verify the fix to be a crucial part of this step. This both ensures that the bug doesn't reappear in the future due to changes in the codebase and avoids possible imprecisions of manual testing. Now, we can explore these steps in more detail, highlighting how the scientific method can guide us through the debugging process. Establishing Clear Debugging Questions (Formulating a Hypothesis) A hypothesis is a proposed explanation for a phenomenon that can be tested through experimentation. In a debugging context, that phenomenon is the bug or issue you're trying to resolve. Having a clear, falsifiable statement that you can prove or disprove ensures that you stay focused on the real problem rather than jumping haphazardly between possible causes. A properly formulated hypothesis lets you design precise experiments to evaluate whether your explanation holds true. To formulate a hypothesis effectively, you can follow these steps: 1. Clearly Identify the Symptom(s) Before forming any hypothesis, pin down the specific issue users are experiencing. For instance: - "Users intermittently see outdated profile information after updating their accounts." - "Some newly created user profiles don't reflect changes in certain parts of the application." Having a well-defined problem statement keeps your hypothesis focused on the actual issue. Just like a research question in science, the clarity of your symptom definition directly influences the quality of your hypothesis. 2. Draft a Tentative Explanation Next, convert your symptom into a statement that describes a _possible root cause_, such as: - "Data inconsistency occurs because the caching layer isn't invalidating or refreshing user data properly when profiles are updated." - "Stale data is displayed because the cache timeout is too long under certain load conditions." This step makes your assumption about the root cause explicit. As with the scientific method, your hypothesis should be something you can test and either confirm or refute with data or experimentation. 3. Ensure Falsifiability A valid hypothesis must be falsifiable - meaning it can be proven _wrong_. You'll struggle to design meaningful experiments if a hypothesis is too vague or broad. For example: - Not Falsifiable: "Occasionally, the application just shows weird data." - Falsifiable: "Users see stale data when the cache is not invalidated within 30 seconds of profile updates." Making your hypothesis specific enough to fail a test will pave the way for more precise debugging. 4. Align with Available Evidence Match your hypothesis to what you already know - logs, stack traces, metrics, and user reports. For example: - If logs reveal that cache invalidation events aren't firing, form a hypothesis explaining why those events fail or never occur. - If metrics show that data served from the cache is older than the configured TTL, hypothesize about how or why the TTL is being ignored. If your current explanation contradicts existing data, refine your hypothesis until it fits. 5. Plan for Controlled Tests Once you have a testable hypothesis, figure out how you'll attempt to _disprove_ it. This might involve: - Reproducing the environment: Set up a staging/local system that closely mimics production. For instance with the same cache layer configurations. - Varying one condition at a time: For example, only adjust cache invalidation policies or TTLs and then observe how data freshness changes. - Monitoring metrics: In our example, such monitoring would involve tracking user profile updates, cache hits/misses, and response times. These metrics should lead to confirming or rejecting your explanation. These plans become your blueprint for experiments in further debugging stages. Collecting and Evaluating Evidence After formulating a clear, testable hypothesis, the next crucial step is to gather data that can either support or refute it. This mirrors how scientists collect observations in a literature review or initial experiments. 1. Identify "Primary Sources" (Logs, Stack Traces, Code History): - Logs and Stack Traces: These are your direct pieces of evidence - treat them like raw experimental data. For instance, look closely at timestamps, caching-related events (e.g., invalidation triggers), and any error messages related to stale reads. - Code History: Look for related changes in your source control, e.g. using Git bisect. In our example, we would look for changes to caching mechanisms or references to cache libraries in commits, which could pinpoint when the inconsistency was introduced. Sometimes, reverting a commit that altered cache settings helps confirm whether the bug originated there. 2. Corroborate with "Secondary Sources" (Documentation, Q&A Forums): - Documentation: Check official docs for known behavior or configuration details that might differ from your assumptions. - Community Knowledge: Similar issues reported on GitHub or StackOverflow may reveal known pitfalls in a library you're using. 3. Assess Data Quality and Relevance: - Look for Patterns: For instance, does stale data appear only after certain update frequencies or at specific times of day? - Check Environmental Factors: For instance, does the bug happen only with particular deployment setups, container configurations, or memory constraints? - Watch Out for Biases: Avoid seeking only the data that confirms your hypothesis. Look for contradictory logs or metrics that might point to other root causes. You keep your hypothesis grounded in real-world system behavior by treating logs, stack traces, and code history as primary data - akin to raw experimental results. This evidence-first approach reduces guesswork and guides more precise experiments. Designing and Running Experiments With a hypothesis in hand and evidence gathered, it's time to test it through controlled experiments - much like scientists isolate variables to verify or debunk an explanation. 1. Set Up a Reproducible Environment: - Testing Environments: Replicate production conditions as closely as possible. In our example, that would involve ensuring the same caching configuration, library versions, and relevant data sets are in place. - Version Control Branches: Use a dedicated branch to experiment with different settings or configuration, e.g., cache invalidation strategies. This streamlines reverting changes if needed. 2. Control Variables One at a Time: - For instance, if you suspect data inconsistency is tied to cache invalidation events, first adjust only the invalidation timeout and re-test. - Or, if concurrency could be a factor (e.g., multiple requests updating user data simultaneously), test different concurrency levels to see if stale data issues become more pronounced. 3. Measure and Record Outcomes: - Automated Tests: Tests provide a great way to formalize and verify your assumptions. For instance, you could develop tests that intentionally update user profiles and check if the displayed data matches the latest state. - Monitoring Tools: Monitor relevant metrics before, during, and after each experiment. In our example, we might want to track cache hit rates, TTL durations, and query times. - Repeat Trials: Consistency across multiple runs boosts confidence in your findings. 4. Validate Against a Baseline: - If baseline tests manifest normal behavior, but your experimental changes manifest the bug, you've isolated the variable causing the issue. E.g. if the baseline tests show that data is consistently fresh under normal caching conditions but your experimental changes cause stale data. - Conversely, if your change eliminates the buggy behavior, it supports your hypothesis - e.g. that the cache configuration was the root cause. Each experiment outcome is a data point supporting or contradicting your hypothesis. Over time, these data points guide you toward the true cause. Analyzing Results and Iterating In scientific debugging, an unexpected result isn't a failure - it's valuable feedback that brings you closer to the right explanation. 1. Compare Outcomes to the hypothesis. For instance: - Did user data stay consistent after you reduced the cache TTL or fixed invalidation logic? - Did logs show caching events firing as expected, or did they reveal unexpected errors? - Are there only partial improvements that suggest multiple overlapping issues? 2. Incorporate Unexpected Observations: - Sometimes, debugging uncovers side effects - e.g. performance bottlenecks exposed by more frequent cache invalidations. Note these for future work. - If your hypothesis is disproven, revise it. For example, the cache may only be part of the problem, and a separate load balancer setting also needs attention. 3. Avoid Confirmation Bias: - Don't dismiss contrary data. For instance, if you see evidence that updates are fresh in some modules but stale in others, you may have found a more nuanced root cause (e.g., partial cache invalidation). - Consider other credible explanations if your teammates propose them. Test those with the same rigor. 4. Decide If You Need More Data: - If results aren't conclusive, add deeper instrumentation or enable debug modes to capture more detailed logs. - For production-only issues, implement distributed tracing or sampling logs to diagnose real-world usage patterns. 5. Document Each Iteration: - Record the results of each experiment, including any unexpected findings or new hypotheses that arise. - Through iterative experimentation and analysis, each cycle refines your understanding. By letting evidence shape your hypothesis, you ensure that your final conclusion aligns with reality. Implementing and Verifying the Fix Once you've identified the likely culprit - say, a misconfigured or missing cache invalidation policy - the next step is to implement a fix and verify its resilience. 1. Implementing the Change: - Scoped Changes: Adjust just the component pinpointed in your experiments. Avoid large-scale refactoring that might introduce other issues. - Code Reviews: Peer reviews can catch overlooked logic gaps or confirm that your changes align with best practices. 2. Regression Testing: - Re-run the same experiments that initially exposed the issue. In our stale data example, confirm that the data remains fresh under various conditions. - Conduct broader tests - like integration or end-to-end tests - to ensure no new bugs are introduced. 3. Monitoring in Production: - Even with positive test results, real-world scenarios can differ. Monitor logs and metrics (e.g. cache hit rates, user error reports) closely post-deployment. - If the buggy behavior reappears, revisit your hypothesis or consider additional factors, such as unpredicted user behavior. 4. Benchmarking and Performance Checks (If Relevant): - When making changes that affect the frequency of certain processes - such as how often a cache is refreshed - be sure to measure the performance impact. Verify you meet any latency or resource usage requirements. - Keep an eye on the trade-offs: For instance, more frequent cache invalidations might solve stale data but could also raise system load. By systematically verifying your fix - similar to confirming experimental results in research - you ensure that you've addressed the true cause and maintained overall software stability. Documenting the Debugging Process Good science relies on transparency, and so does effective debugging. Thorough documentation guarantees your findings are reproducible and valuable to future team members. 1. Record Your Hypothesis and Experiments: - Keep a concise log of your main hypothesis, the tests you performed, and the outcomes. - A simple markdown file within the repo can capture critical insights without being cumbersome. 2. Highlight Key Evidence and Observations: - Note the logs or metrics that were most instrumental - e.g., seeing repeated stale cache hits 10 minutes after updates. - Document any edge cases discovered along the way. 3. List Follow-Up Actions or Potential Risks: - If you discover additional issues - like memory spikes from more frequent invalidation - note them for future sprints. - Identify parts of the code that might need deeper testing or refactoring to prevent similar issues. 4. Share with Your Team: - Publish your debugging report on an internal wiki or ticket system. A well-documented troubleshooting narrative helps educate other developers. - Encouraging open discussion of the debugging process fosters a culture of continuous learning and collaboration. By paralleling scientific publication practices in your documentation, you establish a knowledge base to guide future debugging efforts and accelerate collective problem-solving. Conclusion Debugging can be as much a rigorous, methodical exercise as an art shaped by intuition and experience. By adopting the principles of scientific inquiry - forming hypotheses, designing controlled experiments, gathering evidence, and transparently documenting your process - you make your debugging approach both systematic and repeatable. The explicitness and structure of scientific debugging offer several benefits: - Better Root-Cause Discovery: Structured, hypothesis-driven debugging sheds light on the _true_ underlying factors causing defects rather than simply masking symptoms. - Informed Decisions: Data and evidence lead the way, minimizing guesswork and reducing the chance of reintroducing similar issues. - Knowledge Sharing: As in scientific research, detailed documentation of methods and outcomes helps others learn from your process and fosters a collaborative culture. Ultimately, whether you are diagnosing an intermittent crash or chasing elusive performance bottlenecks, scientific debugging brings clarity and objectivity to your workflow. By aligning your debugging practices with the scientific method, you build confidence in your solutions and empower your team to tackle complex software challenges with precision and reliability. But most importantly, do not get discouraged by the number of rigorous steps outlined above or by the fact you won't always manage to follow them all religiously. Debugging is a complex and often frustrating process, and it's okay to rely on your intuition and experience when needed. Feel free to adapt the debugging process to your needs and constraints, and as long as you keep the scientific mindset at heart, you'll be on the right track....

“Music and code have a lot in common,” freeCodeCamp’s Jessica Wilkins on what the tech community is doing right to onboard new software engineers cover image

“Music and code have a lot in common,” freeCodeCamp’s Jessica Wilkins on what the tech community is doing right to onboard new software engineers

Before she was a software developer at freeCodeCamp, Jessica Wilkins was a classically trained clarinetist performing across the country. Her days were filled with rehearsals, concerts, and teaching, and she hadn’t considered a tech career until the world changed in 2020. > “When the pandemic hit, most of my gigs were canceled,” she says. “I suddenly had time on my hands and an idea for a site I wanted to build.” That site, a tribute to Black musicians in classical and jazz music, turned into much more than a personal project. It opened the door to a whole new career where her creative instincts and curiosity could thrive just as much as they had in music. Now at freeCodeCamp, Jessica maintains and develops the very JavaScript curriculum that has helped her and millions of developers around the world. We spoke with Jessica about her advice for JavaScript learners, why musicians make great developers, and how inclusive communities are helping more women thrive in tech. Jessica’s Top 3 JavaScript Skill Picks for 2025 If you ask Jessica what it takes to succeed as a JavaScript developer in 2025, she won’t point you straight to the newest library or trend. Instead, she lists three skills that sound simple, but take real time to build: > “Learning how to ask questions and research when you get stuck. Learning how to read error messages. And having a strong foundation in the fundamentals” She says those skills don’t come from shortcuts or shiny tools. They come from building. > “Start with small projects and keep building,” she says. “Books like You Don’t Know JS help you understand the theory, but experience comes from writing and shipping code. You learn a lot by doing.” And don’t forget the people around you. > “Meetups and conferences are amazing,” she adds. “You’ll pick up things faster, get feedback, and make friends who are learning alongside you.” Why So Many Musicians End Up in Tech A musical past like Jessica’s isn’t unheard of in the JavaScript industry. In fact, she’s noticed a surprising number of musicians making the leap into software. > “I think it’s because music and code have a lot in common,” she says. “They both require creativity, pattern recognition, problem-solving… and you can really get into flow when you’re deep in either one.” That crossover between artistry and logic feels like home to people who’ve lived in both worlds. What the Tech Community Is Getting Right Jessica has seen both the challenges and the wins when it comes to supporting women in tech. > “There’s still a lot of toxicity in some corners,” she says. “But the communities that are doing it right—like Women Who Code, Women in Tech, and Virtual Coffee—create safe, supportive spaces to grow and share experiences.” She believes those spaces aren’t just helpful, but they’re essential. > “Having a network makes a huge difference, especially early in your career.” What’s Next for Jessica Wilkins? With a catalog of published articles, open-source projects under her belt, and a growing audience of devs following her journey, Jessica is just getting started. She’s still writing. Still mentoring. Still building. And still proving that creativity doesn’t stop at the orchestra pit—it just finds a new stage. Follow Jessica Wilkins on X and Linkedin to keep up with her work in tech, her musical roots, and whatever she’s building next. Sticker illustration by Jacob Ashley....

Demystifying React Server Components cover image

Demystifying React Server Components

React Server Components (RSCs) are the latest addition to the React ecosystem, and they've caused a bit of a disruption to how we think about React. Dan Abramov recently wrote an article titled "The Two Reacts" that explores the paradigms of client component and server component mental models and leaves us with the thought on how we can cohesively combine these concepts in a meaningful way. It took me a while to finally give RSCs the proper exploration to truly understand the "new" model and grasp where React is heading. First off, the new model isn't really new so much as it introduces a few new concepts for us to consider when architecting our applications. Once I understood the pattern, I found an appreciation for the model and what it's trying to help us accomplish. In this post, I hope I can show you the progression of the React architecture in applications as I've experienced them and how I think RSCs help us improve this model and our apps. A "Brief" History of React Rendering and Data-Fetching Patterns One of the biggest challenges in React since its early days is "how do we server render pages?" Server-side rendering (SSR) is one of the techniques we can use to ensure users see data on initial load and helps with our site's SEO. Without SSR, users would see blank screens or loading spinners, and then a bunch of content would appear shortly after. An excellent graphic on Remix's website demonstrates this behavior from the end user's perspective and it's a problem we generally try to avoid as developers. This problem is so vast and difficult that we've been trying to solve it since 2015. Rick Hanlon from the React Core Team reminded us just how complicated this problem was recently. If you think react is complicated now, go back to 2015 when you had to configure babel and webpack yourself, you had to do SSR and routing yourself, you had to decide between flow and typescript, you had to learn flux and immutable.js, and you had to choose 1 of 100 boilerplates— Ricky (@rickhanlonii) January 28, 2024 But SSR has its issues too. Sometimes SSR is slow because we need to do a lot of data fetching for our page. Because of these large payloads, we'll defer their rendering using lazy loading patterns. All of a sudden we have spinners again! How we've managed these components has changed too. Over the years, we've seen a variety of patterns emerge for managing these problems. We had server-side pre-fetching where we had to hydrate our frontends application state. Then we tried controller-view patterned components for our lazily loaded client-side components. With the evolution of React, we were able to simplify the controller-view patterns to leverage hooks. Now, we're in a new era of multi-server entry points on a page with RSCs. The Benefits of React Server Components RSCs give us this new paradigm that allows us to have multiple entries into our server on a single page. Leveraging features like Next.js' streaming mode and caching, we can limit what our pages block on for SSR and optimize their performance. To illustrate this, let's look at this small block of PHP for something we might have done in the 2000s: index.php ` For simplicity, the blocks indicate server boundaries where we can execute PHP functionality. Once we exit that block, we can no longer leverage or communicate with the server. In this example, we're displaying a welcome message to a user and a list of posts. If we look at Next.js' page router leveraging getServerSideProps, we would maybe write this same page as follows: pages/posts.jsx ` In this case, we're having our server do a lot to fetch the data we need to render this page and all its components. This also makes the line between server and client much clearer as getServerSideProps runs before our client renders, and we're unable to go back to that function without an API route and client-side fetch. Now, let's look at Next.js' app router with server components. This same component could be rendered as follows: app/posts/page.tsx ` This moves us a bit closer back to our PHP version as we don't have to split our server and client functionality as explicitly. This example is relatively simple and only renders a few components that could be easily rendered as static content. This page also probably requires all the content to be rendered upfront. But, from this, we can see that we're able to simplify how server data fetching is done. If nothing else, we could use this pattern to make our SSR patterns better and client render the rest of our apps, but then we'd lose out on some of the additional benefits that we can get when we combine this with streaming. Let's look at a post page that probably has the content and a comments section. We don't need to render the comments immediately on page load or block on it because it's a secondary feature on the page. This is where we can pull in Suspense and make our page shine. Our code might look as follows: app/posts/[slug]/page.jsx ` Our PostComments are a server component that renders static content again, but we don't want its render to block our page from being served to the client. What we've done here is moved the fetch operation into the comments component and wrapped it in a Suspense boundary in our page to defer its render until its content has been fetched and then stream it onto the page into its render location. We could also add a fallback to our suspense boundary if we wanted to put a skeleton loader or other indication UI. With these changes, we're writing components similarly to how we've written them on the client historically but simplified our data fetch. What happens when we start to progressively enhance our features with client-side JavaScript? Client Components with RSCs All our examples focused on staying in the server context which is great for simple applications, but what happens when we want to add interactivity? If you were to put a useState, useEffect, onClick, or other client-side React feature into a server component, you'd find some error messages because you can't run client code from a server context. If we think back to our PHP example, that makes a lot of sense why this is the case, but how do we work around this? For me, this is where my first really mental challenge with RSCs started. Let's use our PostComments as an example to enhance by in-place sorting the section from the server. ` In this example, we're using a server component the same way as our previous example to do the initial data fetch and stream when ready. However, we're immediately passing the results to a client component that renders the elements and enhances our code with a list of sort options. When we select the sort we want, our code makes a request to the server at a predefined route and gets the new data that we re-render in the new order on screen. This is how we might have done things without RSCs before but without a useEffect for our initial rendering. If you're familiar with the old controller-view pattern, this is relatively similar to that pattern, but we have to relegate client re-fetching to the view (client) component, where we might have had all fetch and re-fetch patterns in the controller (server) component Another way to solve this same problem is leveraging server actions, but that would cause the page to re-render. Given the caching mechanisms in Next.js, this is probably fine, but it's not the user experience people are expecting. Server actions are a topic of their own, so I won't cover them in this post, but they're important for the holistic ecosystem experience in the new mindset. Interleaving Nested Server & Client Components These examples have shown a clean approach where we keep our server components at the top of our rendering tree and have a clear line where we move from server mode to client mode. But one of the advantages of RSCs is that we can interleave where our server component entry points may exist. Let's think about a product carousel on a storefront page for example. We may have built this as follows before: ` Here we're rendering carousels that render their cards and our tree goes server -> client -> server. This is not allowed in the new paradigm because the React compiler cannot detect that we moved back into a server component when we called ProductCards from a client component. Instead, we would need to refactor this to be: ` Here, we've changed ProductCarousel to accept children that are our ProductCards server component. This allows the compiler to detect the boundary and render it appropriately. I'd also recommend adding Suspense boundaries to these carousels but I omitted it for the sake of brevity in this example. Some Suggested Best Practices Our team has been using these new patterns for some time and have developed some patterns we've identified as best practices for us to help keep some of these boundaries clear that I thought worth sharing. 1. Be explicit with component types We've found that being explicit with component types is essential to expressing intent. Some components are strictly server, some are strictly client, and others can be used in both contexts. Our team likes using the server-only package to express this intent but we found we needed more. We've opted for the following naming conventions: Server only components: component-name.server.(jsx|tsx) Client only components: component-name.client.(jsx|tsx) Universal components: component-name.(jsx|tsx) This does not apply to special framework file names but we've found this helps us delineate where we are and to help with interleaving. 2. Defer Fetch when Cache is Available If we're trying to render a component that is a collection of other components, we've found deferring the fetch to the child allows our cache to do more for us in rendering in cases where the same element may exist in different locations. This is similar to how GraphQL's data loaders works and can ideally boost the performance of cached server components. So, in our product example above, we may only fetch the IDs of the products we need for the ProductCards and then fetch all the data per card. Yes, this is an extra fetch and causes an N+1, but if our cache is in play, end users will feel a performance gain. 3. Colocate loaders and queries If you're using GraphQL or need loading states for components for Suspense fallback, we recommend colocating those elements in the same file or directory. This makes it easier to modify and manage related elements for your components in a more meaningful way. 4. Use Suspense to defer non-essential content This will depend on your website and needs. Still, we recommend deferring as many non-essential elements to Suspense as possible. We define non-essential to be anything you could consider secondary to the page. On a blog post, this could be recommended posts or comments. On a product page, this could be reviews and related products. So long as the primary focus of your page is outside a Suspense boundary, your usage is probably acceptable. Conclusion RSCs represent a significant evolution in the React ecosystem, offering new paradigms and opportunities for improving the architecture of web applications. They enable multiple server entry points on a single page, optimizing server-side rendering, and simplifying data fetching. RSCs allow for a clearer separation between server and client functionality, enhancing both performance and maintainability. To make the most of RSCs, developers should consider best practices such as being explicit with component types, deferring fetch when caching is available, colocating loaders and queries, and using Suspense to defer non-essential content. Embracing these practices can help harness the potential of React Server Components and pave the way for more efficient and interactive web applications. We're excited about this development in the React ecosystem and the developments happening across teams and frameworks that are opting into using them. While Next.js offers a great solution, we're excited to see similar enhancements to Remix and RedwoodJS....

What does it actually look like to build software with AI today? Not in theory, but in practice. cover image

What does it actually look like to build software with AI today? Not in theory, but in practice.

What does it actually look like to build software with AI today? Not in theory, but in practice. At the Leadership Exchange, this was the question at the center of the Developer Panel, where leaders from across the industry unpacked what’s really changing inside engineering teams and what organizations need to do right now to keep up. The Developer Panel at the Leadership Exchange explored the cutting edge of AI in software engineering and examined what organizations should focus on today to prepare for the future. Moderated by Jeff Cross, Co-Founder & CEO at Nx, the panel featured Victor Savkin, Cofounder & CTO at Nx, Alex Sover, Vice President of Engineering at OpenAP, Brent Zucker, Senior Director of Engineering at Visa, and Jonathan Fontanez, AI Engineering Lead at This Dot Labs. Panelists shared insights into how AI is transforming the software development lifecycle and how teams can adopt tools effectively while preparing for organizational change. Panelists discussed emerging workflows, including CI-in-the-loop, agentic healing, and context engineering. They examined how validation, code reviews, and PRDs are evolving alongside AI capabilities and how teams are integrating external sources such as production traces to improve quality and reliability. The discussion also covered what the next generation of agentic tools might look like and how these capabilities will shape engineering practices in the near future. Adoption of AI comes with challenges. Teams often rely on plugins or extensions without foundational understanding, and individual contributors may fear displacement. Panelists emphasized that education, governance, and skill-building are essential for teams to manage AI agents effectively while maintaining quality. They also highlighted the need to standardize workflows and ensure organizational alignment to fully leverage AI capabilities. The conversation extended beyond technical challenges to organizational implications. Panelists discussed how teams can avoid issues like Conway’s Law, manage distributed teams effectively, and evolve engineering practices alongside AI adoption. Leadership and management strategies play a crucial role in ensuring that AI integration delivers meaningful outcomes while maintaining efficiency and alignment with business objectives. Key Takeaways - AI workflows require both technical and organizational preparation. - Education, governance, and skill development are essential for successful implementation. - Forward-looking teams are rethinking validation, CI pipelines, and context management to fully leverage agentic AI. The discussion highlighted that adopting AI at the cutting edge is not just about new tools - it is about rethinking processes, workflows, and organizational culture. Companies that embrace this holistic approach are most likely to succeed in leveraging AI to its full potential. Are you interested in more conversations like this? Message us for an invite to the next, or for a private discussion around these topics. Tracy can be reached at tlee@thisdot.co....

Let's innovate together!

We're ready to be your trusted technical partners in your digital innovation journey.

Whether it's modernization or custom software solutions, our team of experts can guide you through best practices and how to build scalable, performant software that lasts.

Prefer email? hi@thisdot.co